About
Randy Krum
President of InfoNewt.
Data Visualization and Infographic Design

Infographic Design

Infographics Design | Presentations
Consulting | Data Visualizations

DFW DataViz Meetup

Join the DFW Data Visualization and Infographics Meetup Group if you're in the Dallas/Fort Worth area!

Search the Cool Infographics site

Custom Search

Subscriptions:


Feedburner

The Cool Infographics® Gallery:

How to add the
Cool Infographics button to your:

Cool Infographics iOS icon

- iPhone
- iPad
- iPod Touch


Read on Flipboard for iPad and iPhone

Featured in the Tech & Science category

Flipboard icon

Twitter Feed
From the Bookstore

Caffeine Poster

The Caffeine Poster infographic

Entries in visual (320)

Thursday
Sep032009

reMap: An Amazing Visual Browsing Interface to VisualCompexity.com


Bestario has created reMap, an interactive portal to view all of the infographics posted on VisualComplexity.com, and it's amazing.  They've created semantic connection between the different infographics using tags tat allow for an incredible browsing experience.

An interactive, visual browsing interface to an infographic archive.

reMap displays visualcomplexity.com projects allowing navigation using a semantic approach and depicting relations among them. All images and texts belong to vc portal. Tags are assigned using a semantic engine created by Bestiario.
Thanks Jose!  I love it!

Monday
Aug312009

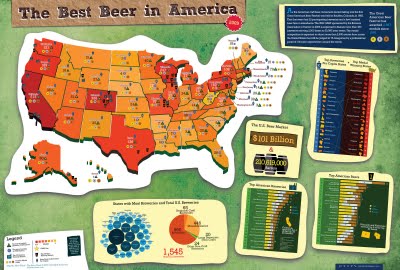
Best Beer in America: 2009 Update!


Our friend, Mike Wirth, has released the 2009 Great American Beer Festival Medal Map, but it's much easier to call it the Best Beer in America Map!

Mike uses the data of the Great American Beer Festival medal winners from 1987-2008, and this year he has added some new infographics to help support the map.  If you live in Oklahoma or North Dakota, I hope you're drinking out-of-state beer!  I'm just saying.

I posted about his original poster here.  The infographic was published on the Lyke2Drink blog, and on Mike's own website.

Nice work Mike!

Tuesday
Aug252009

U.S. Energy Use Decreases in 2008 [infographic]


Infographic from the Lawrence Livermore National Laboratory, this is their estimate for the total U.S. Energy Consumption for 2008.  Although not depicted in the graphic, their estimate for energy usage dropped by 2% from 2007 to 2008, and use of alternative energy sources like wind and solar increased.

Found on CleanTechnica.com


Estimated U.S. Energy use dipped in 2008 to 99.2 quads (quadrillion BTUs), down from 101.2 quads in 2007. Energy flow charts show the relative size of primary energy resources and end uses in the United States, with fuels compared on a common energy unit basis. The amount of energy in one quad is equivalent to that produced by the burning of 36,000,000 tonnes of coal.

Monday
Aug242009

Big Bang Briefly [video]

A new video on YouTube that visually tries to help explain the Big Bang and the creation of the universe.  Narrated by Dr. Janna Levin.  Maybe a little more on the visual illustration side than infographic, but still good.

"We made this video about the Big Bang because the theory is important and amazing, but often misunderstood.

This video was produced without any funding from any outside sources. It was put together with donated creative time from a group with a desire to further public cognition of science

Science has many amazing stories to tell, this is the first. The Big Bang Briefly."
 Found on VizWorld.com

Saturday
Aug222009

Create Your Own Facebook Network Graph


Create a graph of your own network of friends on Facebook with Nexus.  You've seen many visuals of Twitter and Facebook connections, but this one is especially cool because it's your own network.  That's my network chart is above, but you don't care about mine...go create your own!

Found on Twitter

Tuesday
Aug182009

American health care on (4) napkins


Dan Roam, author of Back of the Napkin, has posted a napkin explanation of the American Health Care debate on his blog.  It took him 4 napkins to complete his explanation, but I think he did a really good job trying to help people understand a very complex issue.

He has also published a slideshow of the complete series up on SlideShare.net


Check out Dan's great book, Back of the Napkin.


Tuesday
Aug042009

NEW Death and Taxes 2010 poster!!

First, Jess from WallStats.com has released the 2010 Death & Taxes poster.  This is one of the best infographic examples today.  It's extremely informative, and the topic has a very wide reach.  The Death & Taxes poster from 2007 was my initial post on Cool Infographics, so I'm very excited to see this update.   Now the 2010 version is available to purchase as a poster here. Great job Jess!

Second, I'm really impressed by the viewer code for the poster. It's from Zoomorama.com, and lets me embed the interactive viewer.  The built-in zoom is pretty nice, but the Quick Find index on the left side is the best part.

Friday
Jul312009

Roomba path long exposure photo


Paul Mathew at SignalTheorist.com attached an LED to the top of his Roobma and took a long exposure photograph to document the path the Roomba takes.  iRobot can tell you the Roomba gets into every corner, but it takes a visual like this to really prove it.
"Now here’s something interesting, I set up a photo camera in my room, turned out all the lights and took a long-exposure shot of my roomba doing it’s thing for about 30 minutes. The result is a picture that shows the path of the roomba through it’s cleaning cycle, it looks like a flight map or something. It really hits every spot!"
Thanks to Tyler at RoboticVacParts.com for the link!

Monday
Jul132009

The GOOD Magazine Transparencies Archive


I've posted about a number of the infographics from the GOOD Magazine Transparency series on the blog before, but the great team there has now made their archive of graphics available as a set on Flickr!

Thanks to Amrit Richmond, the Art Editor at GOOD Magazine, for sending the link!

Tuesday
Jul072009

Illinois: Visualizing Music


Jax de Leon just graduated from the graphic design program at SUNY Purchase College School of Art and Design, and was kind enough to share some of her senior project work called Illinois: Visualizing Music. Jax focused on one music album (illinois, by Sufjan Stevens), and visually analyzed different aspects.
This project is an experiment in taking an audio recording of music that is beautiful and personally meaningful to many listeners, deconstructing it from different vantage points, rearranging it, and building it up again into visual interpretations. This project visualizes lyrics, instrumentation, notes, patterns, and word usage. Hopefully these interpretations will provide another way of experiencing this album, although no amount of analysis can adequately represent the visceral response one gets when presented with a compelling piece of music.
Above is one of the word usage circles, and below are a visual of the instruments used in the album and a visual of lyric content. Check out all of her different visualizations and photos from her final exhibition here.


Great job Jax!