About
Randy Krum
President of InfoNewt.
Data Visualization and Infographic Design

Infographic Design

Infographics Design | Presentations
Consulting | Data Visualizations

DFW DataViz Meetup

Join the DFW Data Visualization and Infographics Meetup Group if you're in the Dallas/Fort Worth area!

Search the Cool Infographics site

Custom Search

Subscriptions:


Feedburner

The Cool Infographics® Gallery:

How to add the
Cool Infographics button to your:

Cool Infographics iOS icon

- iPhone
- iPad
- iPod Touch


Read on Flipboard for iPad and iPhone

Featured in the Tech & Science category

Flipboard icon

Twitter Feed
From the Bookstore

Caffeine Poster

The Caffeine Poster infographic

Entries in visual (320)

Tuesday
Oct272009

Eye Tracking Infographic Plots


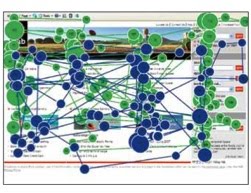
Eye tracking is used is a number of different fields of study; consumer interaction design, advertisements, product packaging, website/software usability, store shelf merchandising design and many more.  The results are plotted visually as an infographic, because it instantly makes the data understandable to the researchers.

In the fixation map image above, a participant's focal points on a website are tracked and the points are numbered in sequential order (like connect-the-dots).  The dots are also each sized based on "Gaze Duration", the amount of time the participant spent looking at that particular point.  In the example above, it took the participant 90 fixations to find the information they were looking for...not a good site design.


Of course, you can narrow down the fixation points and only see the first few points that attracted the participant's attention.  Answering the question "What does the user see first?"  In this example, the participant looking at the flight website saw the hotel ad first.


It's not just for websites.  When you use this method for product packaging, you can tell what the consumer sees in the store during the first few seconds, and the popular understanding is that you only have 3 seconds of the consumer's attention in the store.  The use of the infographic fixation map instantly conveys to the packaging designers what the consumer sees, and what parts of the design are ignored.


The fixation maps are converted into heat maps to aggregate many participant results together.  You can see here that participants aren't seeing the "Diesel for Successful Living" message.

Thanks to Colin from IDG Consulting for providing the images!  I have used IDG for consumer research projects in the past, and I highly recommend them.

Thursday
Oct222009

Left vs. Right Ideology Concept Map


David McCandless and Stefanie Posavec from Information Is Beautiful have created this Left vs. Right concept map to help explain the differences in political opinions.
Of course, the political spectrum is not quite so polarised. Actually, it’s more of a diamond shape, apparently. But this is how it’s mostly presented via the media – left wing vs. right wing, liberal vs. conservative, Labour vs Tory. And perhaps in our minds too… 
This kind of visual approach to mapping concepts really excites me. I like the way it coaxes me to entertain two apparently contradictory value systems at the same time. Or, in other words, I like the way it f**ks with my head.


Using this blank template, David and Stefanie created two versions  One for the U.S. (top) and one for the World (below).
There are two versions with different colours: a US and a World version. This is because the US and Switzerland are the only countries in the world where red = right wing and blue = left wing. Grrr!


Found on VizWorld and Information Is Beautiful.

Wednesday
Oct212009

Circular Periodic Table of the Elements


Mohd Abubakr has redrawn the classic periodic table in a circular pattern to improve the proximity and relationships between the elements.
So why change it? According to Mohd Abubakr from Microsoft Research in Hyderabad, the table can be improved by arranging it in circular form. He says this gives a sense of the relative size of atoms--the closer to the centre, the smaller they are--something that is missing from the current form of the table. It preserves the periods and groups that make Mendeleev's table so useful. And by placing hydrogen and helium near the centre, Abubakr says this solves the problem of whether to put hydrogen with the halogens or alkali metals and of whether to put helium in the 2nd group or with the inert gases.
The strongest feedback about the new circular table is that you have to rotate it to read it.  Kind of a problem when you print a poster and post it in a classroom or a laboratory.  Although I think it's an easy thing to remedy by changing the orientation of the text.

Original post on Technology Review by MIT, and found on VizWorld by Randall Hand.

Tuesday
Oct132009

50 Years of Space Exploration - Visual Flight Map


National Geographic published this amazing flight map that shows the flight paths of all 200 space missions in the last 50 years.  A zoomable map is on the NG website, and a high-res image is available from Adam Crowe on Flickr.

Art by Sean McNaughton, National Geographic Staff, Samuel Velasco, 5W Infographics.

Found on Fast Company.

Monday
Oct122009

How to Crack a Master Lock [infographic]


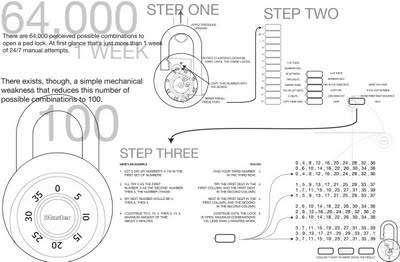
Designed by Mark Edward Campos, this infographic takes the confusing instructions that have been on the Internet for years, and translates them into a simple graphic.  64,000 possible combinations reduced to less than 100 attempts.
This design project was born to understand the inner workings of the padlock, and to develop a notation system to engage the viewer and provide a guide to beat a pad lock.
Found on Gizmodo.

Wednesday
Oct072009

CEO Compensation Infographic Contest Winner!


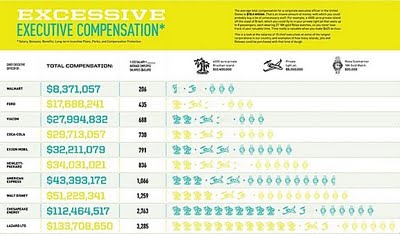
In September, GOOD magazine held an infographic contest to illustrate the top CEO compensation packages.  The above infographic by Dee Adams wins the prize!
Dee Adams’s piece “The Top 8 of CEO Compensation” does an excellent job of illustrating the massive salaries of CEOs and relating them to regular employees in a clean and simple manner. It’s our winner, and Adams will take home our prize package, including a GOOD T-shirt, a free subscription, and $250. You’ll be able to see her infographic in print in our next issue as well.
All of the entries are available for viewing here, but I wanted to include a few of my other favorites:


By Robin Richards:


By Jessica Karle:


Friday
Sep252009

Infographic Stickers for your Walls


From Hu2 Design, cocktail recipe infographics for your wall (drink not included).  They've created different ones for Rum, Tequila, Whiskey, Gin and Vodka that show the drink recipes for the common mixed drinks.  They're also available in different colors to help coordinate with your wall colors, and the website lets you see the color graphics on different wall colors to find what you are looking for.
Hu2 Vinyl Stickers are designed to be applied to any smooth surface including walls, windows & furniture. The vinyl’s are completely removable and leave no residue.
Also available is a cocktail ingredients by percentage infographic.


They also have bath tub level indicators, cable organizers, and things not to be forgotten as you leave your house.  In addition to the infographic stickers, they offer a bunch of fun, decorative and well designed wall decals as well.  Go check them all out at Hu2.com

Thanks Romain!

EDIT: You can also follow Hu2Design on Twitter!


Wednesday
Sep232009

Check Out Your Own Online DNA - Visually


Check out Personas, an interactive, online DNA visualizer.  You enter your own name (or anyone's name for that matter) and watch the system as it categorizes you from online searches.  I've displayed my own DNA above.  The types of attributes it associates with your name are based on the text it finds in the search results.


As you watch Personas analyze the search results you can see that in my case, it doesn't differentiate between me and the other Randy Krums of the world, so our attributes are blended together into one common DNA.


Personas shows you how the Internet sees you.  Upon entering a name, it scours the Internet looking for characterizing statements to use in its analysis.  After suitable information has been found, the viewer watches as the machine tries to make sense of the displayed text.  Once it has reached its final conclusions, the resulting "Personas vector" is displayed and annotated with a minimal legend.
Personas is just one part of the Metropath(ologies) exhibit, now currently on display at the MIT Museum through September 2009 (it needs a new home!).  Metropath(ologies) is a participatory installation about living in a world overflowing with information and non-stop communication, a world in which you are simultaneously the audience and the subject.  It is deliberately ambiguous about the desirability of this communication abundance, riding the line between serene and sinister.
Found on VisualThinkMap.

Wednesday
Sep162009

Oxford Crime Heatmaps from the BBC


As part of the BBC launching thier new show called The Truth About Crime, they have launched a new "Crime Map" website that uses heatmaps to show real crime data for Oxford, England.  The heatmaps are visual representations of all the crime data available for the 12-month period from November 2007 to November 2008.

The website is designed to allow users to explore crime patterns, discover more about potential risks and take action to prevent crime.  The site features a specifically commissioned crime map of Oxford created with data supplied by the city's emergency services.

Why are you using heatmaps?
There are a number of methods for mapping crime. Currently, the technique most often used is to map crime data according to geographic areas such as postcodes, census output areas or police 'beat-codes'. The geographic areas chosen to map crime data – such as 'beat-codes' by the police – are often done so because these services deploy their resources according to their chosen geographical areas.
However, as these geographical areas vary greatly in size, when crime data is plotted on a map it is often difficult for a member of the general public to properly see and understand which areas have high or low crime rates. A large area may seem to have more crime than a small area even though this is simply because there is more space and people in that area. A small area with high crime might be hard to spot because it is simply physically smaller on the map, and therefore harder to see.
After extensive consultation with a host of experts in this specialist area, we have decided to use 'heatmaps' to display our crime data, since these offer a clear way for us all to see patterns of crime, without requiring us to have the expert knowledge of crime data analysts, nor a prior knowledge of arbitrary geographical areas. These 'heatmaps' represent the relative amount of crime according to a sliding scale of colour (as detailed in the "Key"), and provide a sense of the area where a type of crime is happening without disclosing the exact location that it took place – so as to protect the anonymity of victims
Heat maps such as these have not previously been used to any great extent in the UK, but have been used in the USA and Canada.
A number of different maps are available showing Crime Patterns Over Time, Burglary & Theft, Violent Crime, Anti-Social Behavior and the ability to compare to your own neighborhood (if you live in the U.K.)

Friday
Sep042009

New Hans Rosling video, using GapMinder (Must see!)

New TED Talk video of Hans Rosling talking to the U.S. State Department, "Let my dataset change your mindset".  Using the GapMinder software that was purchased by Google, Hans shows the third world isn't as far behind the U.S. as most people believe.