About
Randy Krum
President of InfoNewt.
Data Visualization and Infographic Design

Infographic Design

Infographics Design | Presentations
Consulting | Data Visualizations

DFW DataViz Meetup

Join the DFW Data Visualization and Infographics Meetup Group if you're in the Dallas/Fort Worth area!

Search the Cool Infographics site

Custom Search

Subscriptions:


Feedburner

The Cool Infographics® Gallery:

How to add the
Cool Infographics button to your:

Cool Infographics iOS icon

- iPhone
- iPad
- iPod Touch


Read on Flipboard for iPad and iPhone

Featured in the Tech & Science category

Flipboard icon

Twitter Feed
From the Bookstore

Caffeine Poster

The Caffeine Poster infographic

Entries by Randy (1654)

Monday
Apr242017

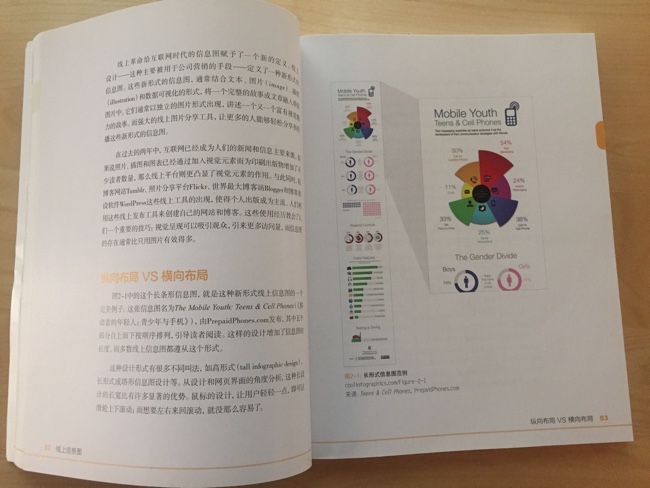
Cool Infographics Book in Chinese!

I was finally able to get my own printed copy of the Chinese translated version of the Cool Infographics book! According to my publisher, Wiley, it has been translated into Simplified Chinese, and Orthodox Chinese, Korean and Russian versions are still in the works. The Chinese version is available in the US through Amazon.

Of course, the only way I can tell what the Chinese translation says is to translate it back into English with the Google Translate app. They translated the title "Cool Infographics" into 可视化沟通, which translates back to English as "Visual Communication". I know the app isn't perfect, but you can get the general meaning.

Just under 5% of the Cool Infographics web traffic comes from China, so I know there are a lot of fans there.


I had to work with the Wiley editors to get the chapter colors to show up along the page edges. My thoughts were that it's a visual communication book, and you should be able to find the chapters visually! The translated version got that right too:


Friday
Apr212017

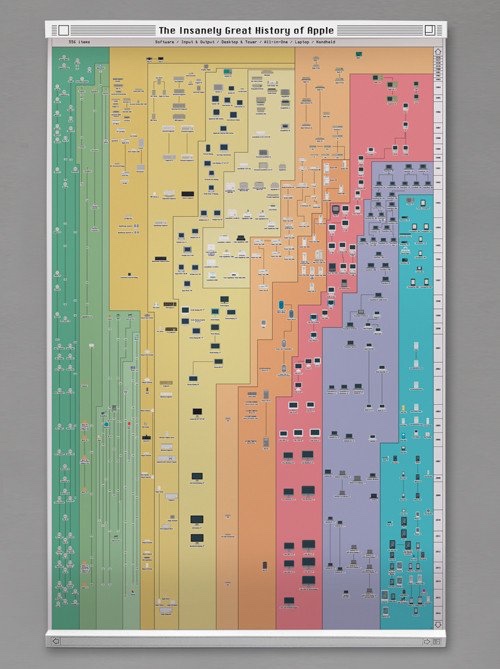
534 Apple Products On One Giant Poster

534 Apple Products on One Giant Poster are included in The Insanely Great History of Apple 3.0 poster from Pop Chart Lab. It is the new and improved list of all Apple products ever made! You can buy a 28"x 42" print of the infographic here.

Newly refreshed with recent Apple products including the 9.7" iPad Pro and the iPhone SE, the world's most comprehensive mapping of Apple products is back just in time for Apple's 40th Anniversary--and is now printed on demand on beautiful exhibition canvas! This classic gallery of proprietary gadgets displays every computer, handheld, peripheral, software, and operating system released by Apple from 1976 onward. Over 500 items in all, chronicling how Apple has invented—and reinvented—insanely great products.

What's more, this canvas print comes bundled with laser-engraved System 6 Window Bar Rails for a throwback-OS mounting solution.

Found on Fast Company Design!

Tuesday
Apr182017

Big Data Bootcamp in Dallas May 5-7

I'll be giving my talk "What is Good DataViz Design?" at the Big Data Bootcamp in Dallas, May 5-7, 2017 at the Irving Convention Center. There will be other fantastic speakers as well, including Barrret Clark, author of the Data Visualization Toolkit, which is this month's giveaway!

For anyone interested in attending the entire event, get $200 OFF your registration cost by using the discount code DFWDATAVIZ and this LINK. The discount is good for registrations until April 27th.

Monday
Apr172017

Interview about DataViz & Infographics Design


Expert Interview – Data Visualization & Infographics

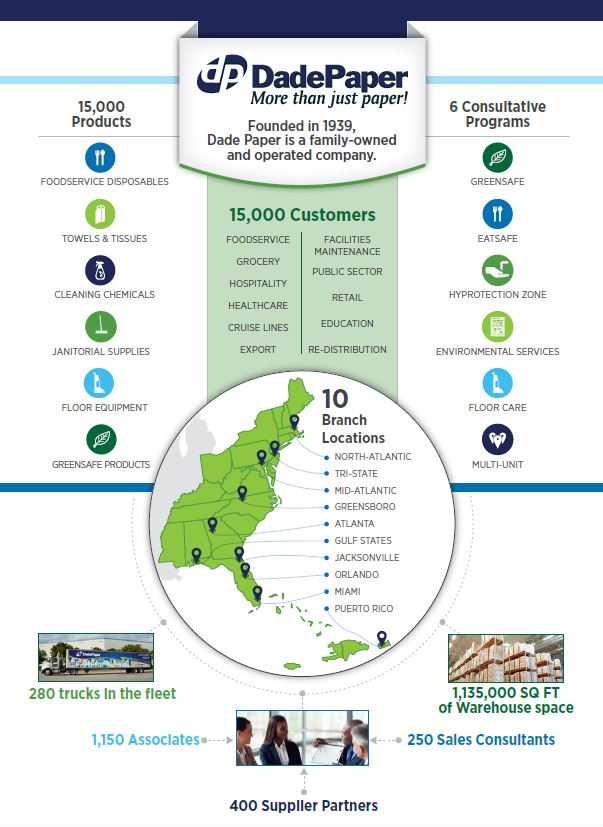
Last week I was interviewed for a new article by Dade Paper all about Data Visualization and Infographics design. The interview covered some of the best reasons to use infographics for marketing and advice for anyone that wants to start using infographics as a part of their marketing strategy.

Check out the full interview HERE 

Friday
Apr142017

The Best Times to Post to Social Networks

The Best Times to Post to Social Networks infographic

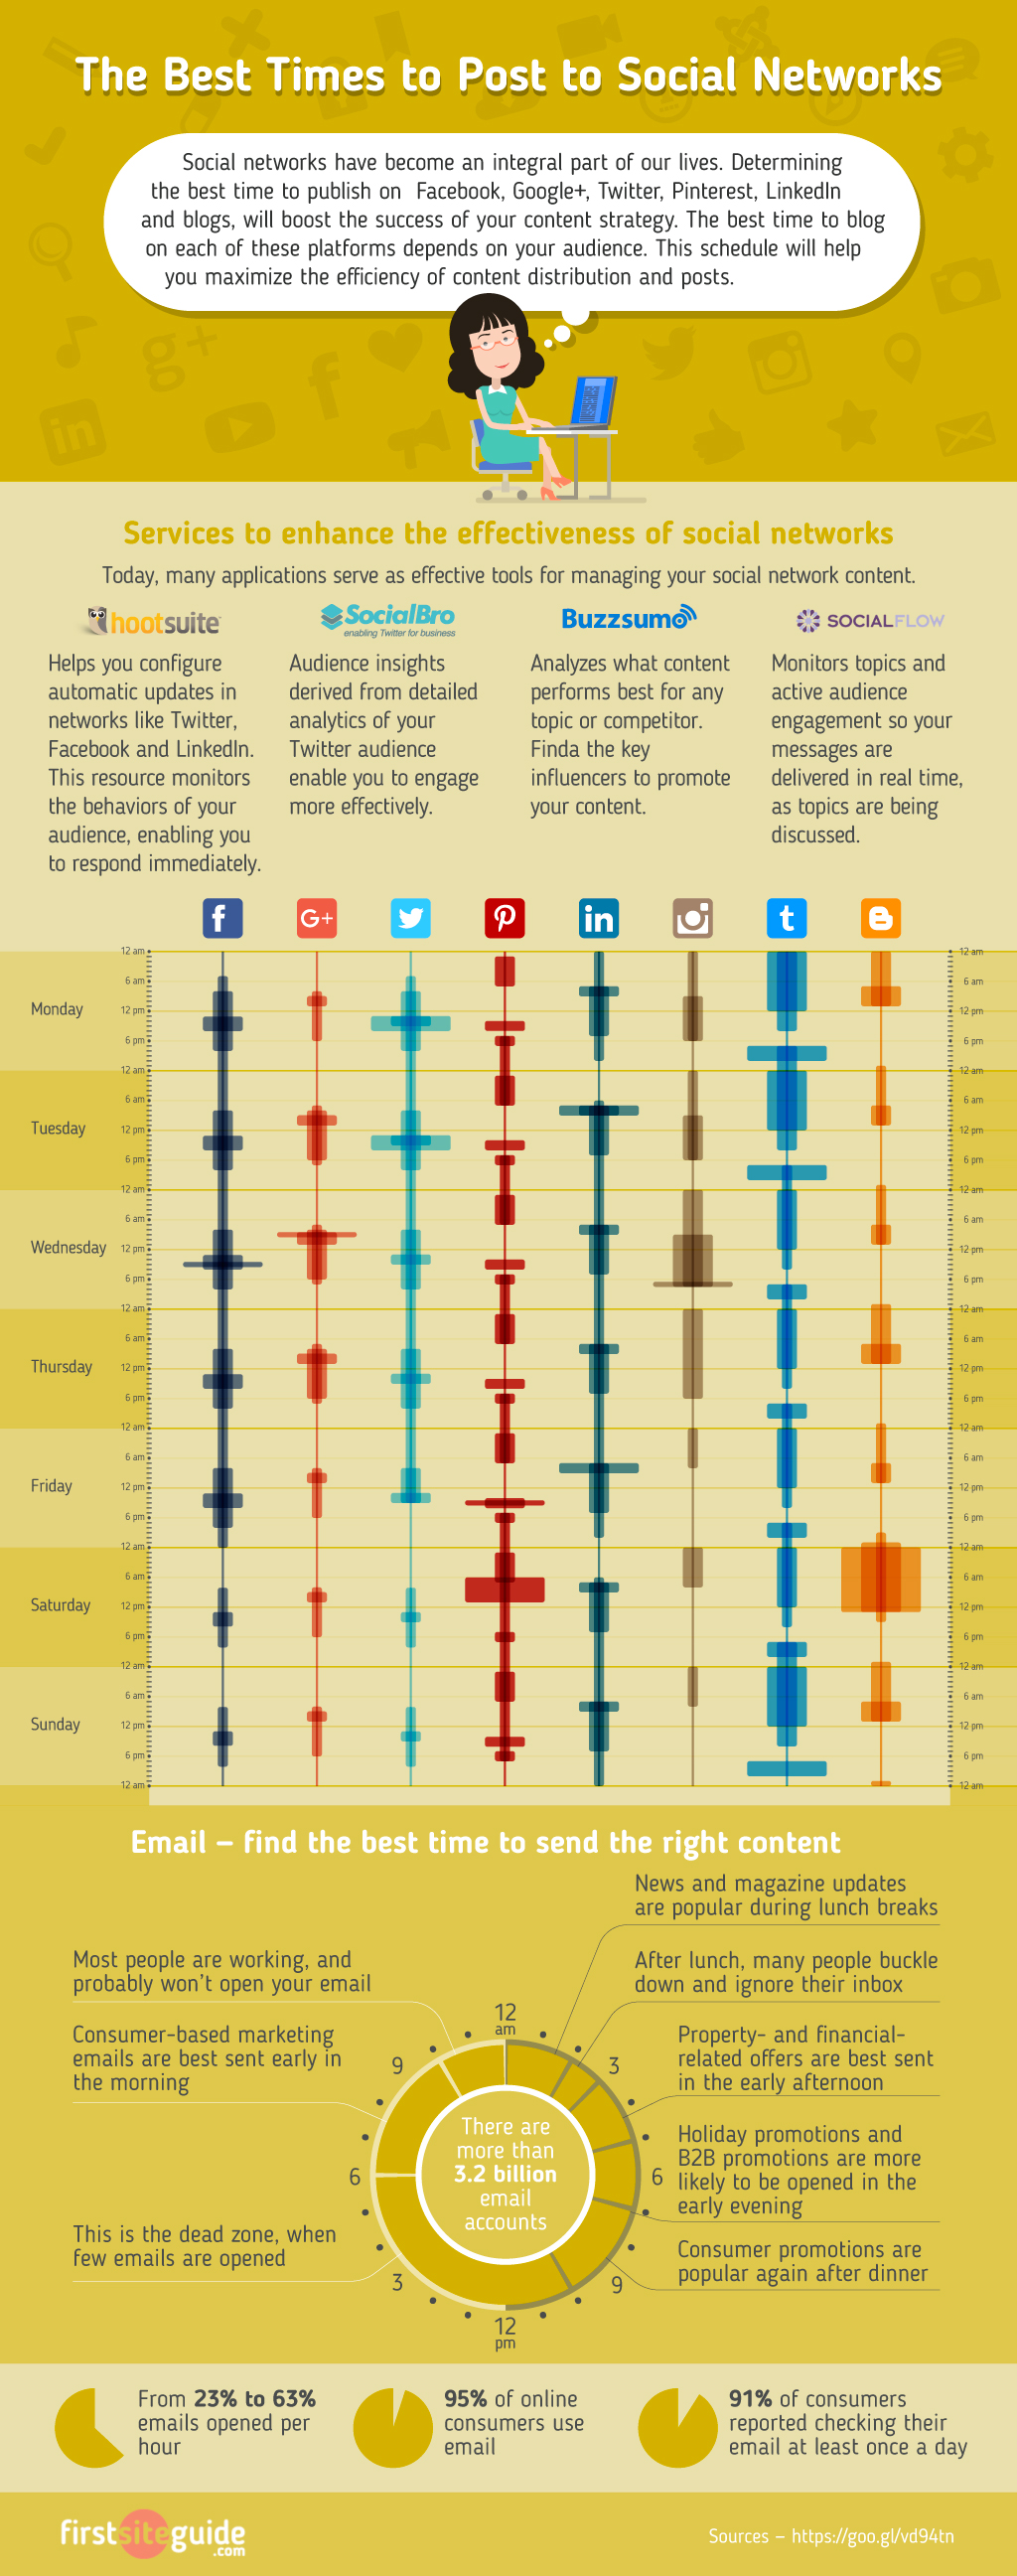
When you are promoting your product through social media platforms, you want to make sure you are setting yourself up for success. First Site Guide has published the The Best Times to Post to Social Media infographic cheat sheet gives you data on the daily high traffic times of each platform to increase the likelihood of your post being seen. It also gives tips on times to send emails based on your content. 

Social media’s all about throwing the metaphorical spaghetti at the wall and seeing what sticks, right? No. No, it’s not! Chances are good you saw that twist coming, but this First Site Guide cheat sheet is all about why time and type matter on social media. Believe it or not, there is a rhythm and a pulse to the tweets and the posts, and patterns of sharing and engaging with content which can be examined scientifically.

Why should you care, though? Well, as it turns out, knowledge is power and someone who knows when to post, where to post, what to post, and how often to post gets a lot more bang for their buck than someone who just sporadically adds random content to whichever social media platform has their attention.

Knowing your audience is an important part of the process. Did you know that emails containing news and magazine updates get opened more often during the lunch hour, but holiday promotions are best sent in the evenings?

There's some really good information here that was gathered from a number of different sources. However, I have a handful of serious issues with this design:

  • Is this data credible? I can't tell from what is shared on the infographic itself. The Sources link is just a shortened URL, so no visibility to where the sources of the data.
  • The Sources link is a downloadable Word DOC from a Russian cloud stoage site. The document includes nine links to data sources, but many of them are broken links.
  • Is the data visualization, I'm guessing the wider sections of the stream are the better times to post. There's no explanation.
  • For the Email section, the time wheel has the days and nights reversed (AM vs. PM). We don't all go to sleep for six hours after lunch.
  • A couple of text typos in the infographic.
  • The footer should include a copyright and the URL to the original infographic landing page so readers can find the full-size original when people don't share the actual link.
  • How do time zones play into these times and scheduling posts?

Thanks to Peter for sending in the link!

Monday
Apr032017

The Data Visualization Toolkit signed book giveaway

For the April Giveaway, I have a signed copy of the Data Visualization Toolkit by Barrett Clark.  Register on the Giveaways Page by April 30th to be entered. 

From Amazon:
Data Visualization Toolkit is your hands-on, practical, and holistic guide to the art of visualizing data. You’ll learn how to use Rails, jQuery, D3, Leaflet, PostgreSQL, and PostGIS together, creating beautiful visualizations and maps that give your data a voice and to make it “dance.”
 
Barrett Clark teaches through real-world problems and examples developed specifically to illuminate every technique you need to generate stunningly effective visualizations. You’ll move from the absolute basics toward deep dives, mastering diverse visualizations and discovering when to use each. Along the way, you’ll build three start-to-finish visualization applications, using actual real estate, weather, and travel datasets.
 
Clark addresses every component of data visualization: your data, database, application server, visualization libraries, and more. He explains data transformations; presents expert techniques in JavaScript, Ruby, and SQL; and illuminates key concepts associated with both descriptive statistics and geospatial data. Throughout, everything is aimed at one goal: to help you cut through the clutter and let your data tell all it can.

Barrett recently gave a talk called "Making Data Dance" at the DFW DataViz Meetup event, and I had a chance to ask him a few quesitons:

What does it mean to make your data "Dance”?

Barrett Clark: I think data wants to tell a story. Our job is to figure out what that story is and how to best present it. Seeing the data in a visual way can make it come to life and dance.


Who is the book written for?

Barrett Clark: Data Visualization Toolkit focuses on looking at data from the perspective of a web developer. More specifically, I speak from the perspective of a developer writing Ruby on Rails apps. There is a fair amount of JavaScript and SQL throughout the book, and I try to explain what I am doing throughout the text. My goal was to make a book that is accessible to anyone while still giving more experienced developers something valuable.


Can readers get all of the data and code you reference in the book?

Barrett Clark: Absolutely! There are 3 different applications that readers will build throughout the book. The code and data for the applications are available on GitHub at http://DataVisualizationToolkit.com. I also have checkpoints throughout the text where you can see what the application should look like at that point. Those are enumerated in the README for each application.


Why do you prefer PostgreSQL as your database platform of choice?

Barrett Clark: I have worked with several databases. PostgreSQL, or Postgres as it is often called, is by far my favorite. It is a robust database that is easy to use, has a wide array of functions and data types, and is also extendable. You can easily add to the functionality of a Postgres database with an extension. In fact, the core database ships with dozens of extensions that you don't need to install. PostGIS, which allows you to store geospatial data and perform geospatial queries, is one of my favorite extensions.


Why is the database and transforming your data before your create the visualizations so important?

Barrett Clark: I have seen very few data sets where you can take data directly from the database into a chart -- especially with transactional data. You can perform the data transformations in the database using SQL, in the application server using the application's prorgamming language, or in the browser using JavaScript. Databases are really good at dealing with data, so I encourage people to not be afraid to write SQL to pull out the data in the format that you need it.


What are the challenges for visualizing data on websites?

Barrett Clark: Speed. When you have a lot of data you need to be thoughtful about how quickly you can get the data and display it in a meaningful way. This may require some additional setup to store data for reporting in a separate format so that you don't have to do the transformations in real time. Another challenge is that you have no control over the end user's viewing experience. Something that you think looks brilliant on your laptop may look awful on someone else's screen.


What’s different about visualizing geospatial data?

Barrett Clark: Geospatial data is a lot of fun! When you add location to the mix you open up a whole new arena of things that you can do visually with your data, and questions that you can ask of the data. I love maps. I take readers through the creation of one of my favorite types of map -- the choropleth. That's where you color areas (counties, states, etc) in a map based on the data.


Are your visualizations mostly static or interactive data visualizations?

Barrett Clark: There are some mouseover effects in my visualizations that help add more context to the graph or highlight something.


What are your thoughts on D3.js and its future?

Barrett Clark: I love D3, and I also love what Mike Bostock has done to build such a deep assortment of examples. Between the examples and the documentation I find D3 really fun to work with. The library is also very actively maintained. As soon as I shipped Data Visualization Toolkit a new version of D3 dropped. There are branches in all 3 sample project repositories on GitHub with the updates required for D3v4.


Are you speaking at any upcoming presentations or webinars?

Barrett Clark: In the past few months I've spoken at PGConf Silicon Valley in San Francisco and RubyConf Australia in Melbourne. I'll be taking a break from travel for a bit and focusing on local meetups. I try to get out to the Dallas Ruby meetups whenever possible.


What’s the best place to follow you online?

Barrett Clark: I'm @barrettclark on Twitter.

Wednesday
Mar292017

Visualising The Beatles Signed Book Giveaway

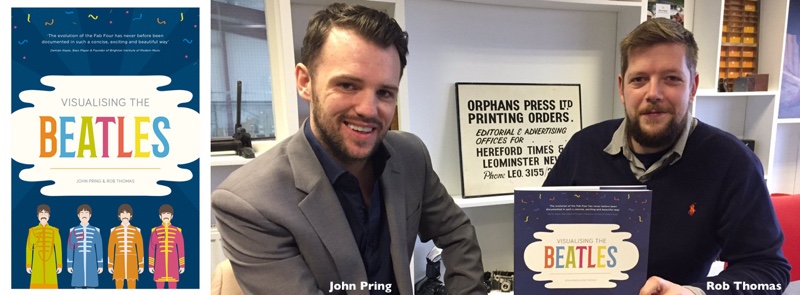
Don't miss your chance to register for the Giveaway in March! I have one SIGNED COPY of the new infographics book Visualising The Beatles by John Pring and Rob Thomas!

Register below by 11:59pm CT on March 31, 2017 to be entered. A winner will be randomly selected on April 1st.

This is the story of the Beatles told as never before.

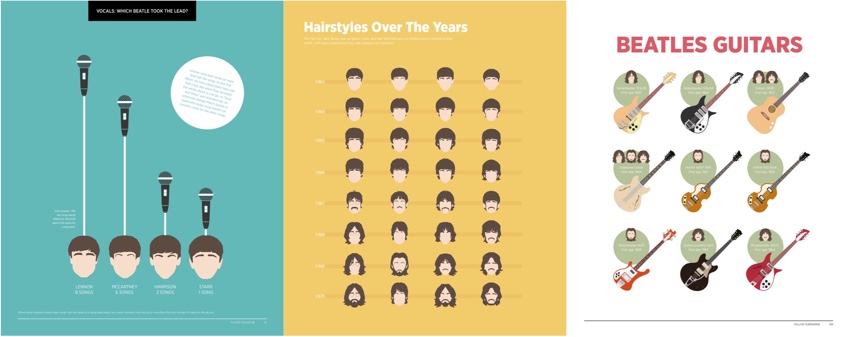
Explored visually, through stunning infographics and data visualisations, this book takes you on a vibrant ride through the Beatles years – from their first Cavern Club gig to the release of Let It Be.

Presenting unique, witty and surprising facts and stories, covering everything from their style to plans
for a Beatles Island, Visualising the Beatles charts how four young men evolved into one of the world’s greatest bands. It also includes beautiful visuals created from the data their music left behind, divided by album, to allow you to spot, in an instant, the patterns, anomalies and changes in the band’s lyrics, instruments, songwriting and performances.

The perfect gift for any fan of the Beatles or infographics.


Wednesday
Mar292017

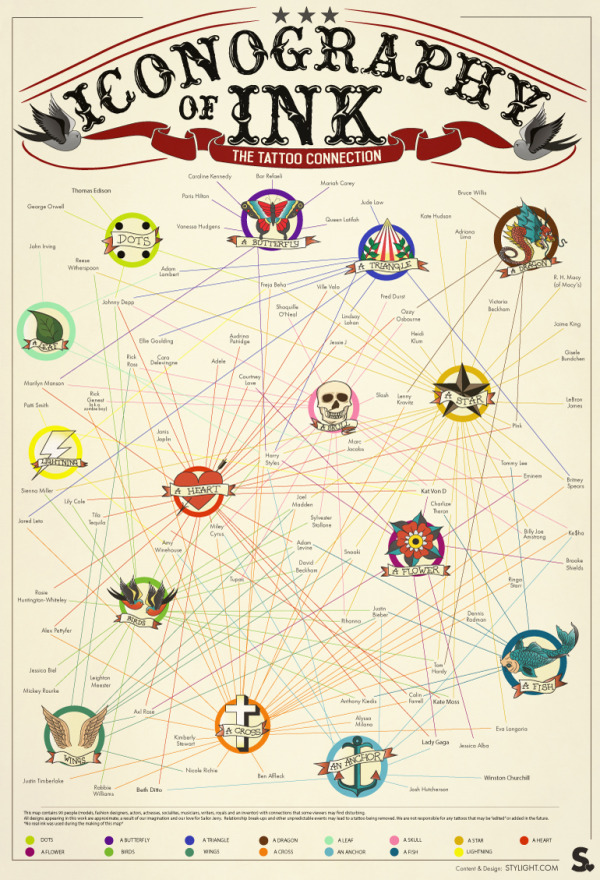
Iconography of Ink

Iconography of Ink infographic

Iconography of Ink, created by Stylight.com, maps out 90 celebrity tattoos and their connections to one another. You can find other interesting facts and tips about tattoos at Stylight.com.

Tattoos—originating from the Tahitian word ‘tatau’—have decorated the skins of endless cultures, spanning thousands of years. Both Polynesian tribes and Italian monks donned such skin art, not to mention, world-traveling sailors and European monarchs.

Fast-forward to today and tattoos are common practice amongst all socioeconomic classes. Scan PopSugar, Huffington Post or Vogue magazine and you’re sure to find tattooed musicians, actors and models alike. The celebrity tattoo craze isn’t just a sign of the times, but an entertaining melodrama.

From bad ass Cambodian tigers (read: Angelina Jolie) to ill-advised dedications to spouses (we’re looking at you Melanie Griffith), watching the evolution of Hollywood tattoos rivals even the most absorbing of reality tv shows.

Thanks to Elisa for sending in the link!

Tuesday
Mar282017

Will Your Meeting Suck?

Will Your Meeting Suck? infographic

Are you in charge of scheduling meetings? We all know that nobody tends to like meetings. But you can use the Will Your Meeting Suck flowchart from Join Me to help schedule your next meeting. Avoid some mistakes and maybe you'll be the hero!

Take a spin through our infographic below to consider all the variables of your next meeting – time, location, snack situation – to help determine if your meeting will suck. Once you find out your risk level, you can do something about it

Decision diagrams and flow charts are good at sucking readers in to follow along the different paths.

Thanks to Don for sending in the link!

Monday
Mar272017

The Ultimate Guide to Buying a Juicer

The Ultimate Guide to Buying a Juicer infographic from Juice Producer introduces you to the benefits for juicing and helps you decide what types of juicer is best for you.

Here is our happy infographic guide to buying a juicer, the things you might want to look out for and things to avoid to get the juicer that is going to be right for you.

Simple icons and illustrations create a very informative infographic for readers. An informative infographic is much more likely to be shared than one that feels like an advertisement. It also builds credibility for the publisher, Juice Producer, by being an expert in the industry and sharing easy-to-understand information.

However, there are a couple things I would change. 

  • Minimize the text. Paragraphs are too much for an infographic
  • Include the URL. Where can readers find the original full-size version?
  • Better color choices. Yellow text on the orange backgrounds are very hard to read

Thanks to Dave for sending in the link!

Page 1 ... 6 7 8 9 10 ... 166 Next 10 Entries »