About
Randy Krum
President of InfoNewt.
Data Visualization and Infographic Design

Infographic Design

Infographics Design | Presentations
Consulting | Data Visualizations

DFW DataViz Meetup

Join the DFW Data Visualization and Infographics Meetup Group if you're in the Dallas/Fort Worth area!

Search the Cool Infographics site

Custom Search

Subscriptions:


Feedburner

The Cool Infographics® Gallery:

How to add the
Cool Infographics button to your:

Cool Infographics iOS icon

- iPhone
- iPad
- iPod Touch


Read on Flipboard for iPad and iPhone

Featured in the Tech & Science category

Flipboard icon

Twitter Feed
From the Bookstore

Caffeine Poster

The Caffeine Poster infographic

Entries by Randy (1654)

Wednesday
Aug092017

Landslide for the "Did Not Vote" Candidate in the 2016 Election!

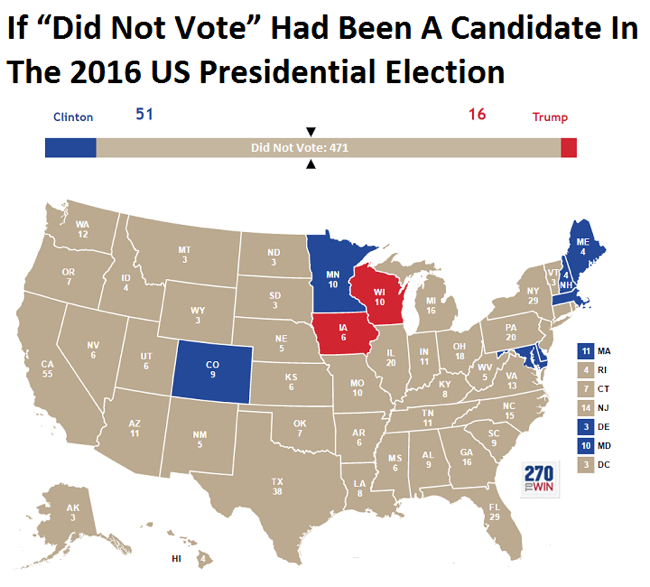
From BrilliantMaps, this is the Did Not Vote Election Map, showing the magnitude if all voting-eligible adults that did not actively vote in the 2016 Presidential election. A Presidential candidate needs 270 Electoral College votes to win. The "Did Not Vote" candidate would have have gathered 41% of the total votes from the voting eligible population, and 471 votes from the Electoral College! A Landslide!

The map above shows what the 2016 US Presidential Election results would have been if votes not cast for Hillary, Trump or one of the third party candidates had gone to fictional candidate “Did Not Vote.”

 As a percentage of eligible voters, Clinton received 28.43% (65,845,063) of all votes compared to Trump’s 27.20% (62,980,160) and Did Not Vote’s 44.37%(102,731,399).

Total voter turnout was estimated to be 55.3% of the voting age population and 59.0% of the voting eligible population.

Map created using 270 To Win, based on reddit user Taillesskangaru’s posts here and updated here.

Disclaimer: The map above was accurate as of January 17th, 2017. Totals below were true at the time of writing but may no longer currently be accurate as additional votes and recounts are conducted.

Thanks to Mike Wirth for sharing on Facebook!

Monday
Jul312017

EARTH, a visualization project

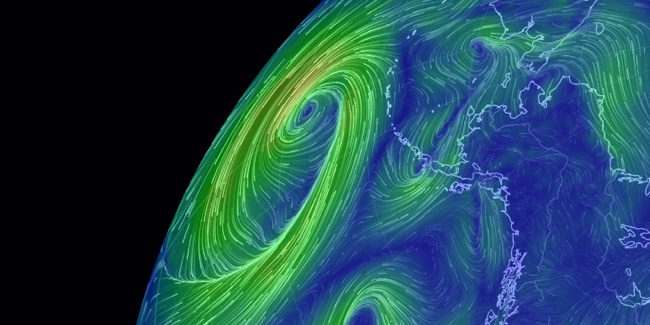
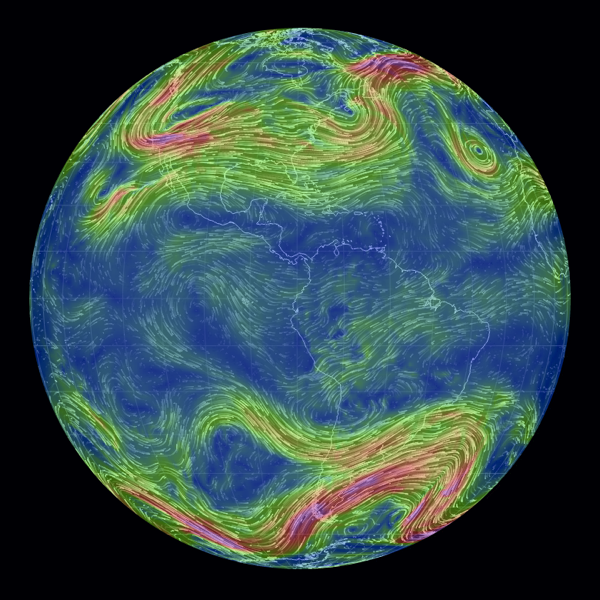
EARTH, by Cameron Beccario, is a beautiful interactive, animated visualization of a few different weather features across the entire globe.

EARTH, by Cameron Beccario, is a near real-time visualization of global weather conditions forecast by supercomputers. This vivid capture depicts intricate, dramatic swirling patterns of wind streamlines reminiscent of oil paintings of the Impressionists.

CAMERON BECCARIO'S creation, Earth. depicts wind patterns on a global scale. The artist began with a wind map of Tokyo, where he lives, and then he took on the world. You can see his animated creation at earth.nullschool.net.

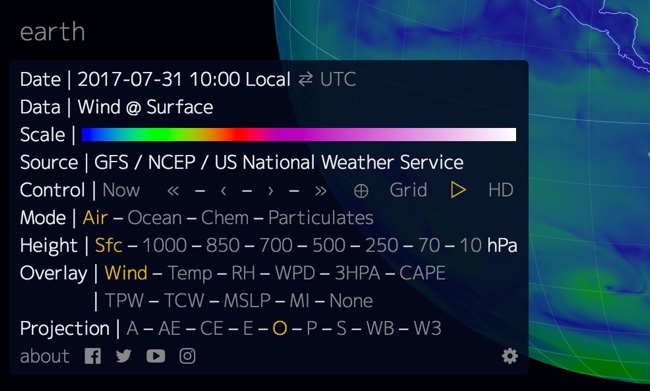
You can spin the globe and zoom in on any area in the World. Opening the setting panel lets you change the data that is being displayed; from wind to ocean waves to particulates in the atmosphere.


To support his project, you can purchase prints of some of the high-resolution images from Point.B Studio 

Designed in D3, all of the source code is also available at https://github.com/cambecc/earth. Of course the project was inspired by the Wind Maps visualization by Fernanda Viégas and Martin Wattenberg, that I have posted about before.

Monday
Jul242017

Laniakea: Visualizing Our Home Supercluster

Very cool new visualization of Laniakea: Our Home Supercluster, which is the supercluster of galaxies that includes the Milky Way. Check out the video and article from Nature.com.

This is potentially the most detailed map of the universe to date, and spans more than 500 million light-years and contains more than 100,000 galaxies. The lines shown in the visualization the paths of motion of the individual galaxies.


Wednesday
Jul192017

Disney Live Action Movies: Best (And Worst)

Disney Live Action Movies: Best (And Worst) infographic

The Disney Dollars infographic from FUN.com compares the total box office revenue for all of Disney's live action movie franchises.

Disney live action films have a long history of wonderful stories, memorable characters, and some big (and by big we mean humongous) box office wins. While the company started in 1923 in animation, quite successfully, they didn’t start making 100% live-action films until the 1950s. Just like the animated films, it didn’t take them long to create a classic (or two or three or four). Remember the frightening steam-punk fantasy of 20,000 Leagues Under the Sea, or the whimsical world of Mary Poppins, or the three-dimensional wizardry of Tron? Even those classics can’t compare to the sheer box office juggernauts of the past two decades. Disney owned the blockbuster with Pirates of the Caribbean, the remakes like Alice in Wonderland and Cinderella, and who could let the holidays go by without a viewing of The Santa Clause…. Of course, with so many films being made, there have been some box office clunkers, as well. Poor Tomorrowland…

This infographic tracks all the live action films that made the top Disney dollar, and lost plenty of Disney dollars, as well.

I understand the overall bar chart design, with bars for the total of each franchise. However, the breakdown of the movies included in each franchise doesn't the distribution of each movies contribution correctly. those are just equal rectangles that span the width of the infographic.  The individual movies should visually show their contribution proportional to the total!

I don't like the scale cheat for the Pirates of the Caribbean franchise. Visually it misleads readers since the franchise has earned almost four times the revenue as the Narnia series.

Also, the length of the Narnia bar is just plain WRONG! Based on the data and the descending order it's supposed to be longer than the Alice in Wonderland bar.

Thursday
Jul132017

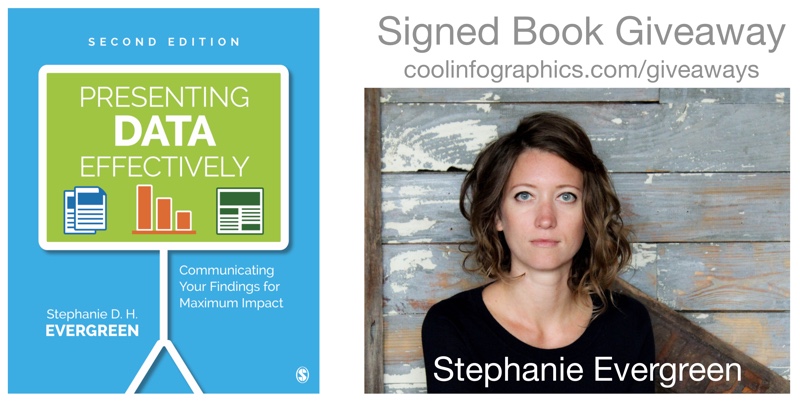
Presenting Data Effectively by Stephanie Evergreen!

Presenting Data Effectively Stephanie Evergreen 2nd Edition Interview and Giveaway

The updated 2nd Edition of Presenting Data Effectively by Dr. Stephanie Evergreen was just released! This is a fabulous resource, and the new edition includes full color images and screenshots as well as new content!

During JULY 2017, I am giving away one signed copy of Presenting Data Effectively! Register on the Giveaways Page by July 31st to be entered.

Now in striking full color, Presenting Data Effectively, Second Edition by Stephanie D. H. Evergreen shows readers how to make the research results presented in reports, slideshows, dashboards, posters, and data visualizations more interesting, engaging, and impactful. The book guides students, researchers, evaluators, and non-profit workers—anyone reporting data to an outside audience—through design choices in four primary areas: graphics, text, color, and arrangement. The Second Edition features an improved layout with larger screenshots, a review of the recent literature on data visualization, and input from a panel of graphic design experts.

Stephanie was very helpful and answered a bunch of questions I sent her about visualizing data and the updated book:

Who is the book intended for?

Stephanie Evergreen: Anyone who has to convey some information to other people should read this book, whether it is in a report, a slideshow, a dashboard, etc.


It’s been 4 years since the 1st edition. What has changed the most?

Stephanie Evergreen: Color! We are finally catching up with the modern world and printing in full color. And speaking of catching up, I’ve included a lot of new content about how we have to change how we report to adapt to a mobile reading culture.


What does it mean to present data effectively?

Stephanie Evergreen: At the very core, that means people understand what we are trying to say. Which means we will have to adjust how we talk about our work so it aligns with how humans come to understand things. So with a little bit of the research behind how brains work, we end up with many significant implications for how we report.


What makes presenting data effectively so challenging?

Stephanie Evergreen: The hardest part is uprooting the ways we have been taught to present, usually from academia. You know what I mean. Lots of bullet points. Dense slides. Too much detail. We think we have to come off this way because it will show we are studious, thorough, and very smart. But reality is that it will only confuse our audiences. And if we are confusing our audiences, we aren’t doing our job. It actually takes in-depth knowledge about a topic to be able to convey it to others with clarity.


What should readers expect to learn and apply to their own presentations?

Stephanie Evergreen: Readers will learn extremely practical guidelines to apply AND the buttons to push to make it happen, right inside the software we all already own.


Is there an ideal balance of text and visuals on a presentation slide?

Stephanie Evergreen: Slides are intended to be a visual support for our talk. So the ideal balance is enough text to frame your key point and a visual that provides the evidence or context for that key point.


How do you help people that are told to only use the company’s colors, fonts and presentation templates?

Stephanie Evergreen: Use them very well. And look for the places where the style guide *doesn’t* dictate your choices – such a font size – and do your magic in those gaps.


What are your thoughts on animated slide transitions and/or clicking to reveal different pieces of information on a slide.

Stephanie Evergreen: Please no transitions. The last thing you want is people thinking “oooh look at how her slide swept away like an ocean tide” because while they are thinking that, they’ve missed everything you were saying. Animating is a different story. Animation can be helpful to break down complex stuff and make it easier to digest. Just don’t be obnoxious (Swivel In, I’m talking about you).


How difficult is it to choose the right chart style?

Stephanie Evergreen: We have a lot of choices, so it can be difficult to even know where to begin. But if you start with your point – the thing you are actually trying to say with this data – you’re headed in the right direction. And coming up with your point, as in really doing the thinking and the analysis, is the hard part.


Is complexity the enemy of good data visualization design?

Stephanie Evergreen: Heck no! Clutter is the enemy of good data visualization design. Complex stuff can be clear and easy if we strip out all the junk.


How do you make it look so easy?

Stephanie Evergreen: I’m funny.


Is there a website to go along with the book?

Stephanie Evergreen: My website rocks. http://stephanieevergreen.com/ My blog is full of tons of resources and I put out new posts every other week that show you exactly how to do what I do. Books are awesome but they take 6 months to print and in that time, I’ve already had a dozen new ideas and the blog is where you’ll find them.


Are you speaking at any upcoming presentations or webinars?

Stephanie Evergreen: I’m on the road, criss-crossing the globe, working with truly awesome folks, giving keynotes and workshops about 35% of my life (typing on a plane right now). Check out my events here: http://stephanieevergreen.com/upcoming-events/ and come say hi or bring me in yourself.


Where’s the best place to follow you online?

Stephanie Evergreen: Dataviz nerds hang out on Twitter, so catch me there https://twitter.com/evergreendata . You can also follow my travel adventures on Instagram at: https://www.instagram.com/severgreen/

Wednesday
Jul122017

Every Total Solar Eclipse in your Lifetime

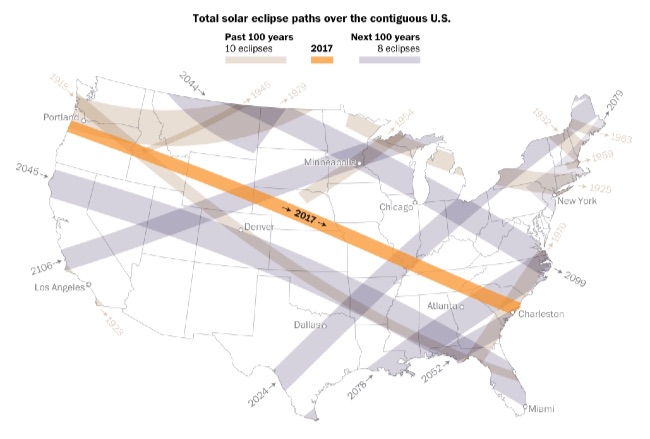
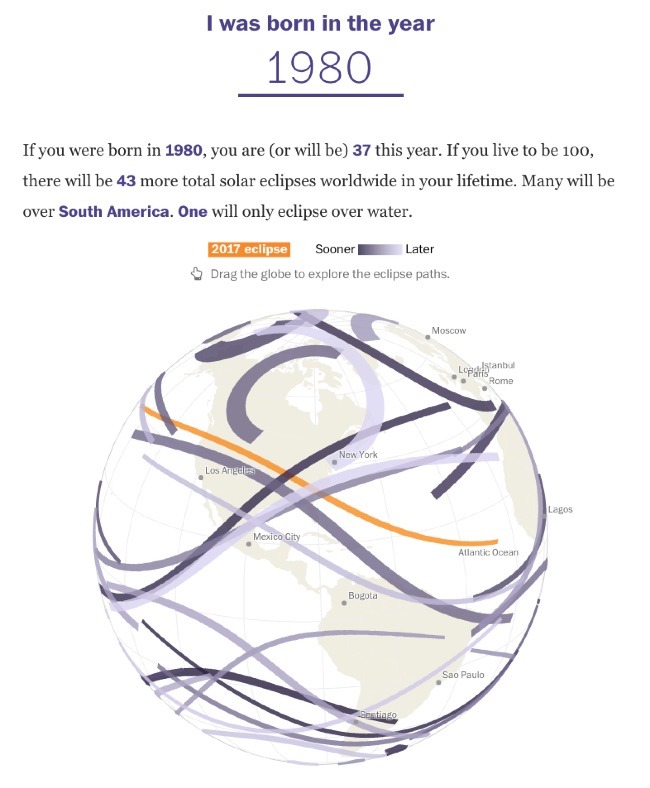
With the upcoming eclipse moving across the U.S. in August, Denise Lu at the Washington Post has created some fantastic visualizations of Every Total Solar Eclipse Happening in your Lifetime.

On Aug. 21, a total solar eclipse will be visible from the contiguous United States. It’ll be the first to traverse coast to coast in nearly a century. There will be 69 total solar eclipses visible from somewhere on the planet in the next 100 years, but only a few will be visible from North America. See how many total solar eclipses are left in your lifetime:

The path of totality for the eclipse in August stretches from coast to coast — passing over Oregon in the west and moving all the way across the country to South Carolina in the east. This is a rare event; it’s the first time the path of totality will eclipse only over the contiguous United States.

The interactive globe visualization is fascinating. Enter your birth year, and it plots all of the solar eclipses that have occurred and will occur during your expected lifetime across the globe.


Thanks to FlowingData and Chiqui Esteban

Tuesday
Jul112017

Fictional Travel Times Compared

Fictional Travel Times Compared Infographic

The Fictional Travel Times infographic from TravelMath compares the speeds from many fictional characters and vehicles from comics, TV and movies.

The universe is a big place – being faster than a speeding bullet is a crawling pace when it comes to interplanetary travel. Science fiction authors have needed to bend the laws of physics to create engines that are capable of going faster than light in order to complete these journeys in any reasonable amount of time. For this reason, there are a handful of superheroes who can travel faster than light, and in some cases, back in time.

See how your favorite superheroes and ships stacked up below, and read our methodology at the end to learn more about the science behind these fictional travel times.

What's your opinion on using Log scales in infographics?

Personally, I don't think enough people are data visualizaiton literate enough to visually understand log scales. Many readers will not understand why the bars don't seem to match the numbers, or won't read the numbers and assume the length of the bars is linear.

Thoughts?

Found on CBR.com

Thursday
Jul062017

Game of Thrones: How Much to Ship Daenerys’ Army?

How Much Would it Cost to Ship Daenerys’ Army? infographic

The team at 1st Move International has calculated How Much Would it Cost to Ship Daenerys’ Army?

The new season of Game of Thrones is on the horizon and *spoiler alert* what this means is we’ll finally get to find out what will happen when Daenerys and her vast army reach the shores of Westeros.

When season six reached its climax, we were left on a tantalising cliff-hanger as Daenerys, complete with three dragons and the backing of both the Unsullied and Dothraki armies, set sail from Meereen in a bid to claim the Iron Throne. It was Ms Targaryen’s sizeable armada, however, that piqued our interest. Shipping large quantities of items is something we specialise in here at 1st Move, and this got us thinking about the logistical efforts behind sending several armies and personnel across the Narrow Sea from Essos to Westeros.

So, we put our heads together and channelled our inner Game of Thrones geekiness to find out what would need moving and just how much this would cost…

Good use of simple white colors on top of the underlying photographs. If you use photos in your infographic design, you want to keep all of the other information in simple colors.

This would be much better if they had visualized the data. Quantities, weights or currency amounts. Visualize the data!

Thursday
Jun292017

How the iPhone Changed Visual Communication

How the iPhone Changed Visual Communication infographic

How the iPhone Changed Visual Communication is a tribute to the profound impact the iPhone has had looking boack on it's 10th anniversary. From Shutterstock

Friday
Jun232017

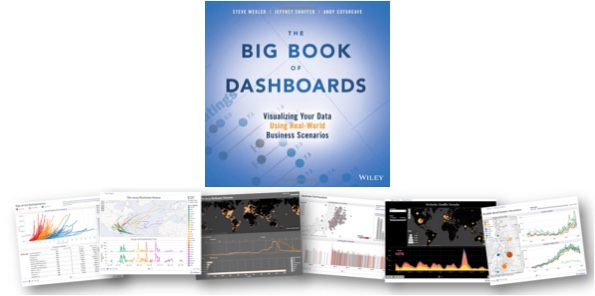
The Big Book of Dashboards!

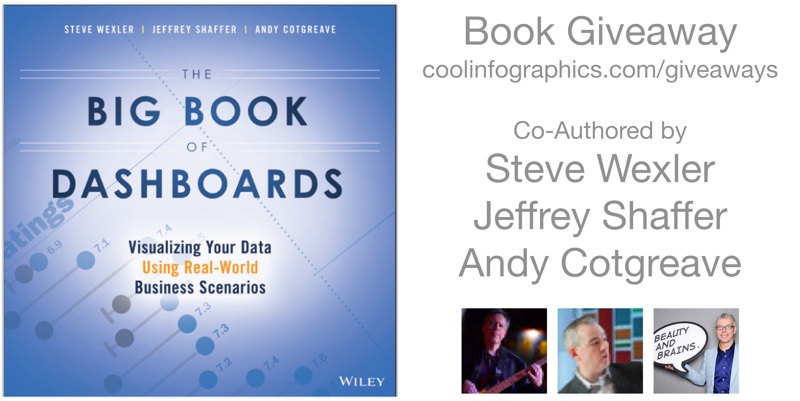
The Big Book of Dashboards is a fantastic new book release in 2017 co-authored by Steve Wexler, Jeffrey Shaffer, and Andy Cotgreave. Published by Wiley, the book is available in print and ebook. You can check it out here on Amazon!

The book starts with good data visualization design practices and then dives into 28 case studies of real dashboard designs in practice. The case studies are design tool agnostic, covering good dashboard designs from a variety of design tools. It doesn't matter what software you use, you will find inspiration and great examples in this book!

I met the co-authors at this year's Tapestry Conference, and interviewed them about the book below.

This month (June 2017) I'm giving away one copy to a lucky winner!  Register on the Giveaways Page by June 30th to be entered.


Who is the book intended for?

Steve Wexler: Anyone tasked with building or overseeing the development of business dashboards.


The three of you are in distant locations from each other. What was your process to collaborate on writing the book?

Steve Wexler: It wasn’t just the three of us!  While we were the authors, the book has 17 contributors and we would have web-sharing sessions with all of them so we could understand the rationale behind the dashboards.  There were also many cases where we would ask them to either defend their decisions or make some refinements.

In any case, we web-conferenced and relied very heavily on Slack to handle asynchronous collaboration.  The slack channels are massive (you should see all the discussions on the definition of the dashboard).

Andy Cotgreave: We also used Join Me for teleconferencing and Dropbox for file sharing. Looking back, it’s incredible how technology facilitates close collaboration across the world. 


How do you define what is a dashboard?

Steve Wexler: A dashboard is a visual display of data used to monitor conditions and / or facilitate understanding. Yes, it’s a broad definition.

Jeff Shaffer: There were long discussions on this one. We really considered Stephen Few’s definition, but picked apart terms like “single screen” and “monitored at a glance”. For example, does printing a dashboard and taking it into a meeting disqualify it from being called a “dashboard”? We think it’s still a dashboard and while it may not be used to monitor something in that instance, it does facilitate understanding. Another example is a “dashboard” that is presented on a tablet or phone where scrolling off a single screen is necessary. Technology, and screen size, is constantly changing, so while our definition is broad, I find it more accurate.


Why should dashboards be elegant or visually appealing?

Steve Wexler: I guess for the same reason that your want a computer, phone, appliance, etc., to be elegant or visually appealing.  For certain, the dashboard must first be functional (i.e., inform, enlighten, and engage) but the “engage” part is more likely if the experience with the dashboard is pleasant.

Andy Cotgreave: You need people to engage with a dashboard. Don Norman defines success according to three levels of processing: Visceral, Behavioural and Reflective. Each needs to succeed. The first response is Visceral - it’s an instant emotional reaction to whether you like something. It takes little effort to ensure the colours, fonts, layout of a dashboard is appealing, but it’s vital to get that visceral response right. The “functional” part comes next, in the behavioural level.


Do dashboards have a size limit? How large can they go?

Steve Wexler: They should be bigger than a bread box and smaller than the Empire State Building. Goodness, it depends on so many things -- the audience, the platform (desktop vs. tablet vs. mobile) and so on.

Looking at the 28 scenarios in the book, with the exception of the Financial Times Economy at a Glance dashboard, none of the desktop-based dashboard have any scrolling (many of the mobile-dashboard do provide for scrolling).  

As for the number of distinct charts on a dashboard the examples run from as few as one to around a dozen.

Interestingly, two of the examples that have a dozen or so charts are from Dundas, but because they are elegant and visually appealing you don’t feel overwhelmed by them.

Andy Cotgreave: Traditionally I’d have said they should fit on a single screen. But as mobile takes over, I think that is changing. The Financial Time Economies at a Glance dashboard is very very tall and designed for scrolling. It works extremely well on mobile. A starting rule of thumb would be to try to keep everything on one page.


How do you address the challenge of choosing the right type of chart for a given data set?

Steve Wexler: That is the raison d'être for the book! Given a particular predicament / scenario, and given the data you have, what is the chart or combination of charts that shine the most, brightest light on the subject?  That’s what we’re trying to do.

And very often that chart or combination of charts may not be what you expect.  Andy wrote a terrific chapter on visualizing time and shows there are so many cases where you don’t want to use a line chart.

Jeff Shaffer: It all starts what you are trying to show with the data. Presenting time is a great example. We have an entire chapter devoted to the different ways to show time, i.e. data over time. Typically a line chart would be a great way to show trend over time, but there are many other ways to visualize time.


What are the key mistakes people make in their dashboards?

Steve Wexler: Too much clutter and not enough clarity.  Plus we’ll often see people putting too much emphasis on decoration and not enough on information.

Jeff Shaffer: The misuse of color. People using color incorrectly or in an overwhelming way. We talk in depth about this in the opening chapter and throughout the book in many of the examples.


What advice would you give young professionals just getting started with visualizing data?

Steve Wexler: Seek feedback when building dashboards.  You need to meet with your audience, often, to make sure what you’re building actually helps the intended audience. 


What’s available for readers on the bigbookofdashboards.com site?

Steve Wexler: There are links to articles, podcasts, and workshops.  We’re also posted downloadable versions of many of the dashboards featured on the book.


Where can people follow all of you online?

Jeff Shaffer -- @highvizability, www.dataplusscience.com
Andy Cotgreave -- @acotgreave, gravyanecdote.com
Steve Wexler, @vizbizwiz, www.datarevelations.com


Are there any events coming up related to the book?

 Steve and Jeff are offering a workshop in Atlanta on June 14  and will be offering more workshops throughout the year (See http://bigbookofdashboards.com/workshops.html)

Andy, Jeff, and Steve will be offering a free webinar on how to build world-class business dashboards on June 21.  (See https://www.tableau.com/learn/webinars/big-book-of-dashboards)

We will all be at the Tableau Conference in Las Vegas, presenting sessions, and signing books!


Page 1 ... 4 5 6 7 8 ... 166 Next 10 Entries »