About
Randy Krum
President of InfoNewt.
Data Visualization and Infographic Design

Infographic Design

Infographics Design | Presentations
Consulting | Data Visualizations

DFW DataViz Meetup

Join the DFW Data Visualization and Infographics Meetup Group if you're in the Dallas/Fort Worth area!

Search the Cool Infographics site

Custom Search

Subscriptions:


Feedburner

The Cool Infographics® Gallery:

How to add the
Cool Infographics button to your:

Cool Infographics iOS icon

- iPhone
- iPad
- iPod Touch


Read on Flipboard for iPad and iPhone

Featured in the Tech & Science category

Flipboard icon

Twitter Feed
From the Bookstore

Caffeine Poster

The Caffeine Poster infographic

Entries in auto (37)

Friday
Nov162012

Choosing the Right Line - The Science of Corners

Choosing the Right Line- The Science of Corners infographic

Choosing the Right Line- The Science of Corners infographic is a design about Motocross.  Motocrossgear.com takes the science of successfully navigating corners in motocross racing and brings it to the infographic world. 

Since the beginning of racing, riders have been faced with many choices on the track. The fastest rider is often the one who chooses the best lines on the track. Many factors exist when deciding which line to take through a corner. Use this visual guide to help you pick the fastest line.

Not a design based on a lot of data, this visual explanation relies more on diagrams to communicate the message.  In general, I really like the design style that reinforces the feel of motorcross, but in my opinion this could be a better design with less text.

Thanks to John for sending in the link!

Friday
Nov092012

Car Sizes Through the Years

Car Sizes Through the Years infographic

It has been a gradual change, however it is definitely there. Our cars have gotten bigger. Automotive.com walks us through some of our favorite car’s growth spurts in the Car Sizes Through the Years infographic.

One of the great joys of living in Los Angeles is the wide variety of cars you see on the road. It provides a great contrast, especially when comparing between generations.

For example: a while back, news director Keith Buglewicz was driving down the freeway when he found himself behind a 2013 Ford Mustang, and its 1967 fastback equivalent. The modern Mustang dwarfed its predecessor in every dimension; comparatively speaking, it was mammoth.

When did cars get so big?

I really like this design.  It’s very focused on telling one story about the growing size of cars, and the design style is superb.  By using images and outlines of the actual cars, it tells the story much better than a bar chart would have because the images are recognizable to the reader which improves comprehension.

The design is missing some form of copyright statement and the URL link to the original infographic landing page so readers can find the high-resolution version when they see this posted on other sites.

Thanks to Chris for sending in the link

Monday
Oct012012

Honda Accord: 30 Years of U.S. Production

Honda Accord 30 Years of American Craftmanship infographic

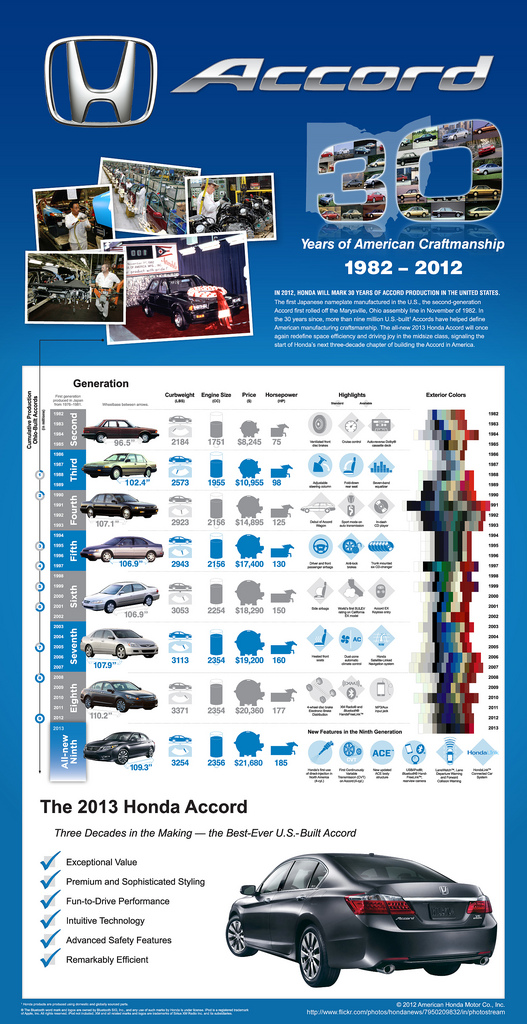
Honda Accord: 30 Years of American Craftmanship is a large infographic from Honda America that was released as part of the release of the new 2013 model design of the Honda Accord in August.  Designed by Jeremy Yingling with InfoNewt (my company) this is a very brand specific, marketing-style infographic.

IN 2012, HONDA WILL MARK 30 YEARS OF ACCORD PRODUCTION IN THE UNITED STATES.

The first Japanese nameplate manufactured in the U.S., the second-generation Accord first rolled off the Marysville, Ohio assembly line in November of 1982. In the 30 years since, more than nine million U.S.-built1 Accords have helped define American manufacturing craftsmanship. The all-new 2013 Honda Accord will once again redefine space efficiency and driving joy in the midsize class, signaling the start of Honda’s next three-decade chapter of building the Accord in America. 

The 2013 model becomes the ninth major design generation of the Accord.  This gave us the opportunity to highlight differences each major model design has brought to the Accord over the last 30 years.  The design visualizes the major technical specifications, the major advancements included in the Accord and shows the multi-year periods that each design generation was available.  The eye-catching color-waterfall shows the available exterior colors available for every model year, and the milestones along the left-side of the design show the progression to reach a cumulative total over 9 million Accords produced in 2012 coming out of the manufacturing plant in Marysville, OH.

Honda has done a great job of utilizing this one infographic design in a handful of different ways.  The infographic was initially used as 9’ banners at the Honda press events, and included in the press kits provided to everyone invited to attend.  Honda has now released the infographic online on the Honda News page on Flickr, making the design available to everyone.

Tuesday
Sep042012

2011 Wisconsin Crash Calendar & Interview

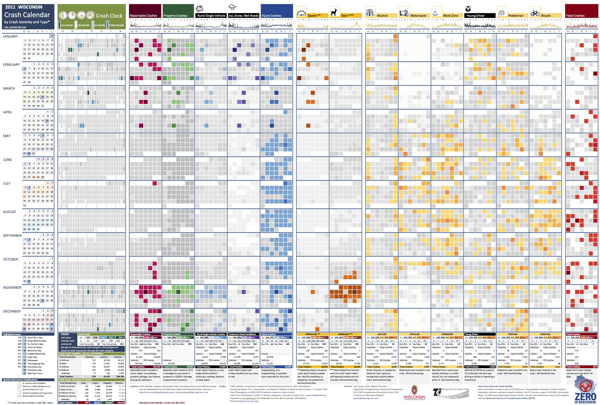
2011 Wisconsin Crash Calendar infographic

I love this infographic design!  Designed by Joni Graves, a Program Director at the University of Wisconsin-Madison Department of Engineering Professional Development (that’s a mouthful!).  I highly recommend downloading the PDF version and taking a closer look on your own.

The original version and a few variations are available on a couple different official sites:

The Wisconsin Bureau of Transportation Safety (BOTS) uses printed copies of the infographic calendar at meetings around the state with various groups to generate discussions about what causes crashes and how to interpret what the data shows.

This design is a great example of how visualizing the data allows the readers to see patterns in the data and much more easily understand the stories behind the data.  The color coding makes it easy to compare the data subsets, and the consistent layout to match a traditional paper calendar is very easy to follow.

There are so many findings you can quickly see in the big dataset.  Some are obvious, but many are surprising.  For example, you can clearly see…

  • Alcohol-related crashes happen primarily on weekends, and fairly consistently throughout the year.
  • Deer Season is clearly identified in Oct-Nov.
  • There was something special about July 1st…
  • Motorcycle, Work Zone and Bicycle crashes occur during the Summer months.
  • Ice, Snow, Wet Road crashes are highest in Jan-Feb, but what happened on April19th?  Late Winter storm?
  • Speed related crashes are primarily reported in the Winter months.
  • Fatal crashes are evenly spread throughout the year

Joni was also willing to answer some interview questions about this project and her design process:

Cool Infographics: What software applications did you use to create the Crash Calendar?

Joni Graves: EXCEL 2010 using Pivot Tables. Presentation advancements incorporate Microsoft’s PowerPivot using SharePoint.

Cool Infographics: Was the design created in cooperation with the Wisconsin Transportation Information Center, or was it an independent project? 

Joni Graves: I’m a Program Director at the UW-Madison Department of Engineering Professional Development and part of the WI LTAP (FHWA’s Local Transportation Assistance Program) / Wisconsin Transportation Information Center (TIC).

Cool Infographics: How long did the design take you to create?

Joni Graves: It’s a longer story, if you’re interested, but the skinny is that I started working on the Crash Calendar format in mid-April and previewed it at a meeting the end of the month. I had a learning curve with some of the intricacies, and spent about 200 hours on it during that two weeks! Since then it’s taken on a life of its own — and I am delighted by that!

Cool Infographics: Would you describe your design process?

Joni Graves: I would be happy to elaborate on this but, as an inveterate designer / tinkerer, I’ll confess that I’m always discovering some new way of formatting / displaying the data, and disappointed that there’s never enough time to do the new ideas justice …

Cool Infographics: What’s the most interesting thing you learned from the data?

Joni Graves: I’ve certainly enjoyed the design process! More importantly, it’s been incredibly satisfying to see people engage w/ the data using this intuitive representation, or to read their comments, because it’s apparent that it helps make the data far more accessible! And I have loved the comments / responses.

Cool Infographics: What was the hardest part behind designing the Crash Calendar?

Joni Graves: As I noted, there’s been a fascinating learning curve. But the hardest part has been stopping! As noted above, I’m always trying to “improve” it — and always running out of time.

Cool Infographics: What should we expect from future versions of the design?

Joni Graves: We currently have a multi-year version, a web-demo site, and a working 2012 version. I’m very excited about incorporating choropleth maps. Although it’s a very interesting “historic” document, the real goal is to provide a resource that is far more timely and potentially predictive for local users. 

I’m really excited about our plans to webize it, because the real idea is to expand it as a national project — using multi-year FARS data, WI data, and data from other interested states — and we really want to “unleash” it for others to actively use. 

Cool Infographics: Challenges?

Joni Graves: There’s been a wonderful response — and we are trying to figure out how to actually fund an expanded project w/ enhancements!

One additional thing to note was that Joni was inspired to create the whole design project by Nathan Yau’s post on Vehicles involved in fatal crashes in 2010 (which I posted about here earlier this year), and I think she has done a great job building Nathan’s initial visualization into some something much more powerful and effective.

Thanks to Joni for sharing!

Tuesday
Jul312012

Evolution of the F1 Car: Video & Infographic

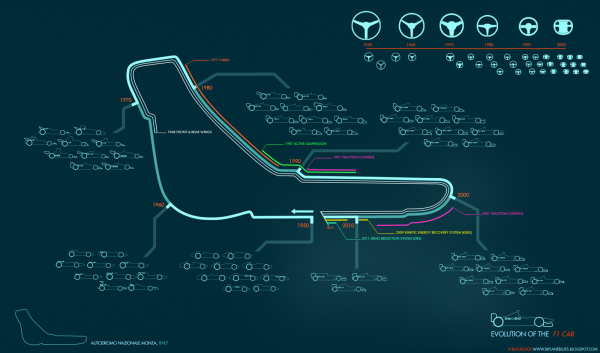
This is totally cool!  Here is an infographic animation created by Rufus Blacklock of his infographic Evolution of the F1 Car. You can find his original video on biplaneblues.blogspot.com.

All done :) here you can watch 60 years of F1 design condensed into a minute. Each car is the winning chassis from the respective seasons. The music is ‘Together’ by She.


Evolution of the F1 Car infographic 

Here is the original Evolution of the F1 Car infographic that the video was based off of. Found at biplaneblues.blogspot.com.

Woo finished! This map tracks the history of F1 cars across the circuit at Monza. Hopefully its clear enough… its my first infographic, let me know if you have any keen ideas to improve readability.

The cars are grouped into decades, around the track you can follow various innovations and driver aids, some which became banned. Top right is steering wheel development.


Monday
Jun182012

Client Infographic: U.S. Motorcycle Helmet Laws

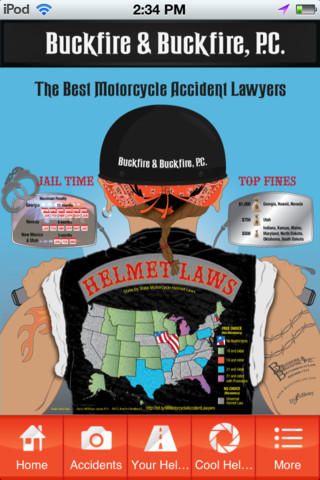
Client Infographic U.S. Motorcycle Helmet Laws

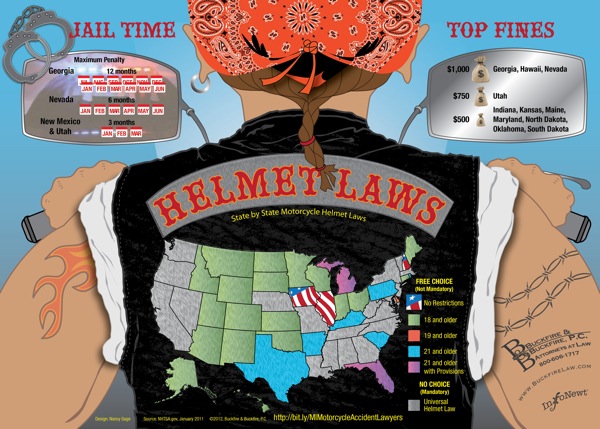
This was a fun project to work on.  The Helmet Laws infographic is a visual reference for all motorcycle riders of the state-by-state helmet laws in the U.S., and also includes a few fact about the states with the highest fines and longest jail time as punishment for breaking those laws.  It’s a light-hearted design meant to make the complex mix of legal requirements easier to understand, because often riders don’t take the time to understand the laws as they cross state borders.

We are actively pursuing lawsuits for injured Michigan motorcyclists and wanted to create an infographic that would be a great resource for riders! The Helmet Laws infographic also displays which states have the highest fines and maximum jail time for violating their helmet law. You should share this infographic with other avid bikers who may be taking a ride across state lines

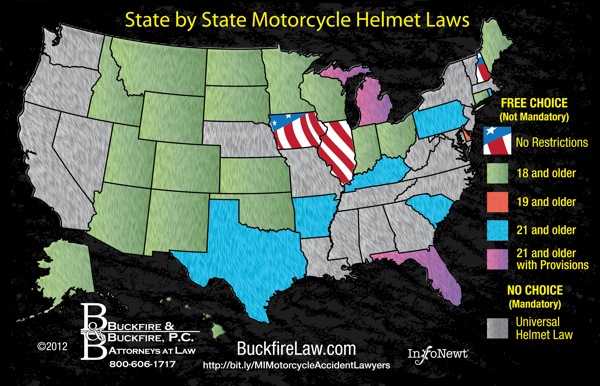
Only three states have no helmet laws at all (Iowa, Illinois and New Hampshire), and 20 states have strict, mandatory helmet laws.  The remaining 28 states fall somewhere in between (Total of 51 because the District of Columbia is included).

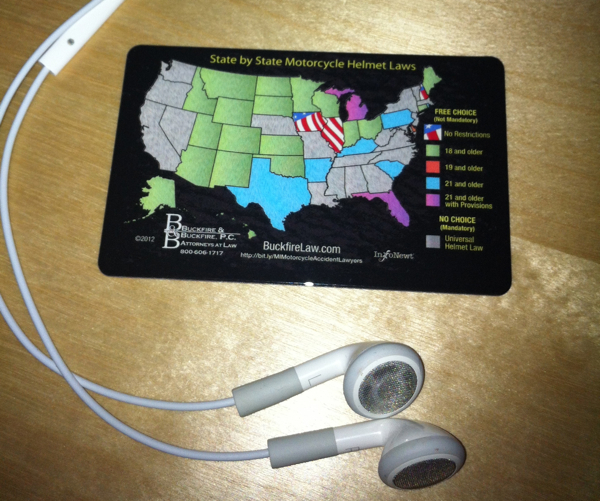
Client Infographic U.S. Motorcycle Helmet Laws Wallet Card

FREE Wallet Cards!  (No longer available)


As an added bonus, small wallet-size card (like a credit card) were printed by Buckfire Law that show just the map visualization and are available FREE to anyone that requests them!  These are meant for any motorcycle rider in the country to carry as a quick reference guide while riding.  You can find the instructions to request a free card on the Motorcycle page of the Buckfire site.  Scroll down past the infographic on their site and you’ll find the link to the online form.  Fill it out, and they will mail one to you for free, so share with anyone you know that rides.

Client Infographic U.S. Motorcycle Helmet Laws Wallet Card Photo

InfoNewt worked with Buckfire & Buckfire Law to develop the design and the wallet card program.  Thanks to the team at Buckfire for being great to work with!

Wednesday
Jun062012

Gymkhana: The Infographic

DC Shoes - Gymkhana Infographic

Gymkhana: The Infographic, is a design collaboration between InfoNewt (my company) and the design team at DC Shoes.  Gymkhana has become a mega-viral hit series of YouTube videos showing Ken Block and his rally car racing through different locations and performing many cool driving stunts.  There have been four Gymkhana videos released on YouTube in the last four years with over 135 million views combined, and Gymkhana 5 is expected this summer!

The DC Ken Block Gymkhana Project is a viral phenomenon with well over 135 Million views worldwide and a collection of more than 40+ videos. The Gymkhana franchise has won countless awards including top rated, most shared video series and most recently received the award for #1 viral video ad of 2011.

Created as a fun way to check out all things Gymkhana, the Infographic displays highlights, amazing stats and facts about the Gymkhana YouTube videos. “The fun just keeps on rolling along,” said Ken Block, the Gymkhana star and co-founder of DC Shoes. “The Gymkhana Infographic puts together some outstanding facts. Even I didn’t know that the Ford Fiesta used in Gymkhana 4 had 9 times the horsepower as my first car, a 1984 Toyota Corolla station wagon. Astounding!”

The infographic brings new viewers up to speed leading up to the release of Gymkhana 5, and gives fans of the videos a bunch of behind-the-scenes information they can’t find anywhere else.

Thanks to the team at DC Shoes for a great project!

Monday
Jun042012

Digital Technology in Your Car

Digital Technology in Your Car

Here is an infographic from Allianz called Digital Technology in Your Car that illustrates current technology in our cars to keep us safe and entertain us.

Digital technology has transformed and continues to transform every aspect of our lives. In the motor industry, technology developed throughout the years has enhanced our safety and comfort. The introduction of modern safety mechanisms such as lane departure warning and brake assist systems as well as iphone applications such as Driver Reviver and Car Butler has seen technology faithfully assisting drivers in times of need. With technology advancing and disseminating at a rapid rate, Global Positioning System units have already become a staple accessory in Australian cars.

There’s not much in the way of data visualizations in this one, but it does tell a good story about the history of new technology in your car, and what’s coming soon.  There’s too much text, but the use of icons and illustrations helps the story.  

I’m not sure what all the dead space at the bottom is.  Plenty of room for the copyright, company logo, URL to the original landing page and even a mention of the designer.

Bring on the self-driving cars!

Thanks to Sandra for sending in the link!

Friday
May252012

NASCAR 101: The Beginner’s Guide to NASCAR

NASCAR 101 The Beginner’s Guide to NASCAR infographic

Have you ever watched NASCAR? Apparently, its the 2nd most popular professional spectator sport in the U.S.! However, if you haven’t, the NASCAR 101: The Beginner’s Guide to NASCAR infographic from Quicken Loans Racing gives an illustrated breakdown of the 2012 Sprint Cup Series.

By now you’ve heard that Quicken Loans is dipping our toes in the whole NASCAR sponsorship world. We’re new to the whole thing, so we decided to put our creative heads together and make a super cool, fun-for-your-eyeballs NASCAR 101 infographic to explain the basics of NASCAR!

Maybe you’re new to racing and could use an introduction?  

Maybe you’re a superfan and you want to help your uninformed friends/family members/random people on the street realize the awesomeness of stock car racing?  

Maybe you like beautifully-designed artwork that is not only pleasing to the eyes but chock full of neat info?


Check it out.

This is a cool infographic design that does a fantastic job of communicating the basics.  Bold color scheme that uses the black background and textures to embody racing.  Simple, clear visualizations that are easy for the reader to understand.  Not too many stats or information crowded into the design to keep the overall design clean.

At the bottom, there should be a copyright statement and the URL to final the original landing page.  I linked back to the original landing page here, but not everyone will.

Found on TopSpeed.com


Monday
Apr092012

CSR and Sustainability Report: Volvo Shaping the Future of Transport

Volvo’s new infographic puts their 2011 CSR (Corporate Social Responsibility) and Sustainability Report into a tidy, easy to read design! Shaping the Future of Transport focuses on Volvo’s environmental, economic, and social responsibility.

All you need to know about the Volvo Group’ CSR and Sustainability Report 2011.

The Volvo Group’s vision is to become world leader in sustainable transport solutions.  We’re convinced that efficient transport is crucial for societal and economic development.  We have the skills, resources and global reach to shape the future of transport.

This is a fantastic use of an infographic as a corporate communication tool.  Volvo is using this infographic as an awareness tool to put their Sustainability Report in front of more readers and broaden the awareness of their efforts.  It’s designed as a top-level overview, and if the reader wants more information, they know how to find the full report.

The illustrations obviously represent the varied forms of transport that Volvo is involved in, and my only criticism is that the design is mostly text.  They list locations, percentages, company historical events and other statistics about Volvo that should all be data visualizations.  At they bottom, they should include the URL to the original landing page, and a copyright statement.

On the original landing page, the whole infographic is a link to their online Sustainability Report front page, but it would have been nice for them to use an HTML Image Map to make the separate statistics and call-outs link to the specific, related web pages in the report.

Thanks to Gustaf for sending in the link!