About
Randy Krum
President of InfoNewt.
Data Visualization and Infographic Design

Infographic Design

Infographics Design | Presentations
Consulting | Data Visualizations

DFW DataViz Meetup

Join the DFW Data Visualization and Infographics Meetup Group if you're in the Dallas/Fort Worth area!

Search the Cool Infographics site

Custom Search

Subscriptions:


Feedburner

The Cool Infographics® Gallery:

How to add the
Cool Infographics button to your:

Cool Infographics iOS icon

- iPhone
- iPad
- iPod Touch


Read on Flipboard for iPad and iPhone

Featured in the Tech & Science category

Flipboard icon

Twitter Feed
From the Bookstore

Caffeine Poster

The Caffeine Poster infographic

Entries in design (479)

Wednesday
Dec242014

The Graphic Continuum - Desktop Version

The Graphic Continuum - Desktop Version

Jon Schwabish and Severino Ribecca have released a full-color, double-sided, laminated 8.5”x11” desktop version of The Graphic Continuum, available for only $10 until the end of the year when the price will go up to $13. This is a smaller version of The Graphic Continuum poster they released earlier this year.

Nearly 90 graphic types grouped into 6 categories on a laminated 8.5”x11” sheet. It does not include every type of graphic, nor does it display every type of link between visualization, but it serves as a thought-starter. Use it to develop ideas, consider different options, or simply as a piece of art.

A fantastic reference of data visualization methods to give you some ideas for ways you can visualize your data differently.

The Graphic Continuum - Desktop Version Page 1

The Graphic Continuum - Desktop Version Page 2

Monday
Dec222014

5 Ways to Market Yourself Visually

Visuals communicate complex ideas into something more digestible. Large amounts of text make it harder for our brains to find pertinent information in a timely manner. This problem can be remedied quite easily, by adding images and visuals into marketing yourself.

Visuals can help turn a complex idea into something more easily digestible, with less effort and time spent by the person viewing it. By putting extra work in on your end, you position yourself to leave a more lasting impression, and stand out from a pile of resumes. Especially when marketing yourself to a recruiter or HR department - making it easier for them to understand your most important work. In Cool Infographics, I cover how visuals are 6.5 times more likely to be remembered than text alone, and there’s no better time to be remembered than when you’re applying for a new job.

Below are five ways to start marketing yourself visually right away:

1. The Infographic Resume

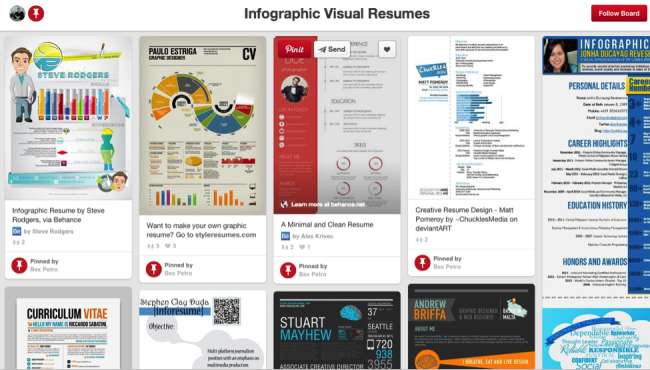
Infographic Resumes Pinterest BoardPinterest Board Gallery of over 900 Infographic Resumes

Infographics are an excellent visual tool to have in your arsenal. They are the pinnacle of displaying complex information in an easily digestible way. Either pay a talented infographic designer, or do one yourself. If you’re not comfortable using graphics design software, check out an excellent free option online like Visme.co - that will have you designing infographics in no time.

Take a look at this Infographic Resume Pinterest Board with over 900 examples for inspiration, and check out the great book The Infographic Resume by Hannah Morgan when you’re ready to get serious about developing your own.


2. Visualize Your LinkedIn Profile

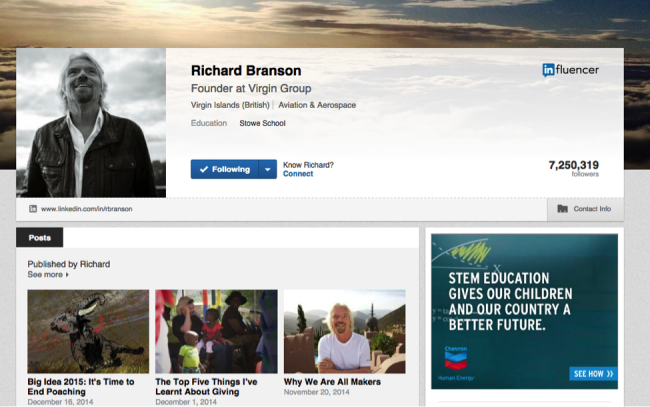
via Richard Branson’s LinkedIn profile

It should be no big surprise that a prospective employer will look at your LinkedIn profile prior to checking you out in person. LinkedIn allows you to add photos and visually rich imagery, so take advantage of these opportunities. If you add companies that Linkedin recognizes to your work history, your profile will automatically display their logos.

Examples could be photos of you working at a trade show, product prototypes you designed, or a photo of you giving a presentation (LinkedIn has Sl SlideShare integration, so embed the presentation in your profile as well). Other images or PDF files work as well, like an advertisement you designed.


3. Create A Visual Portfolio of Your Work


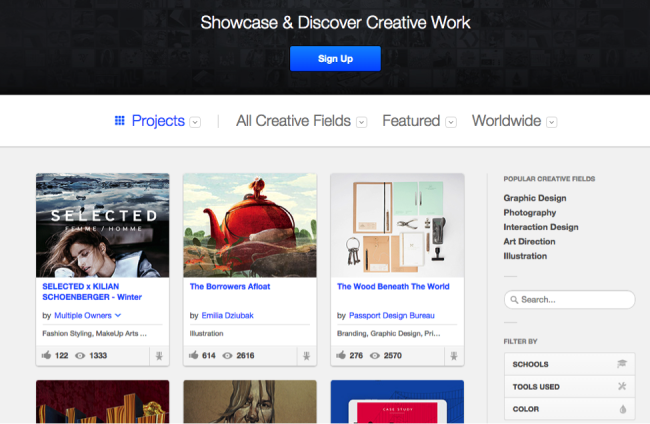
Talking about your creative work only goes so far, you need to provide visuals. Visuals help the employer see what you’re capable of, and gives you the opportunity to control the work they see. Websites like Behance and Dribble are excellent options for creatives of all types. Not only do you get to upload all of your projects, but you get to interact with their creative communities as well - having the chance to inspire others, and be inspired yourself.


4. Create a Blog Post to Provide More Information and Visuals of Your Work


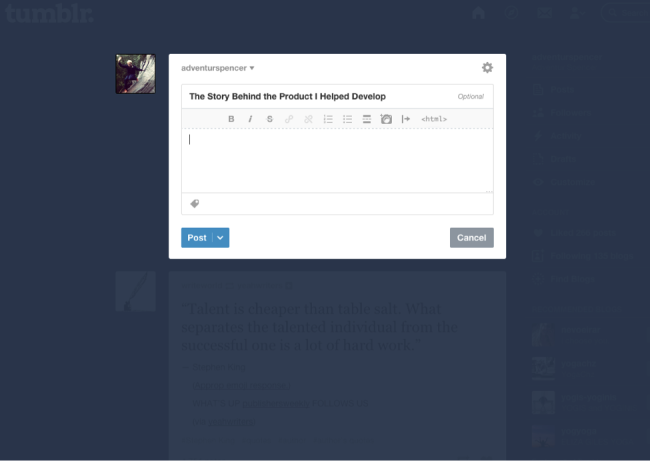
A resume should be a brief overview of skills, previous employment, education, and best works. One page is best. If you would like to expound further upon your projects, then create a blog post - loaded with visuals - that delves deeper into your work.  Tumblr is a great free option for keeping a personal blog.

Include links to any additional content you publish in your Linkedin profile and even on your text resume. Make it as easy as possible for hiring managers and recruiters to find your work.


5. Content Curation

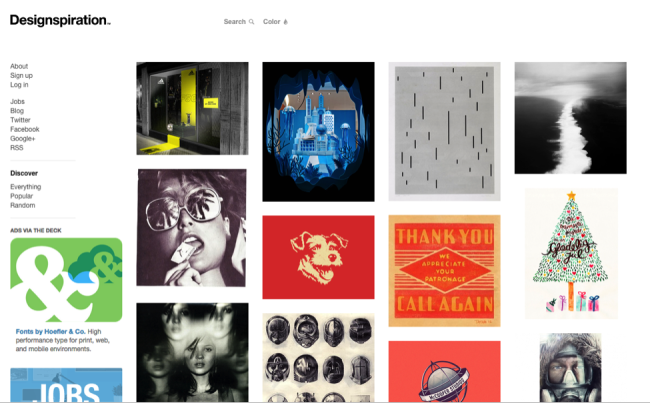
Similar to the idea of creating a blog post to highlight your best work, create a content curation site to highlight the best infographics, articles, quotes, YouTube videos, podcasts, brands, inspirational work, thought leaders, TED talks, and books you’re reading. Show your future employer that you have a passion for gaining knowledge, and are an expert in your field. Pinterest is a great option, and if you’re looking for a design-centric curation site, Designspiration has got you covered.


What other ideas would you recommend?

Friday
Dec192014

The World's Loudest Noises - An Audio Infographic


Loud noises can be unpleasant. But how loud is too loud? The World’s Loudest Noises is an interactive infographic from Air Conditioning Company that explains the loudest noises in the world and how much damage they could do to your ears. So next time your air conditioning kicks on and you feel like complaining… Just remember, there is always something louder.

Turn your volume down before you start clicking!

Our initial attempt to explain how loud air conditioners are via an internet page was, in our opinion, a minor disaster.

An indisputable fact is that 99.999% of us haven’t got a clue what a decibel either sounds like or looks like! Let’s be honest, we didn’t even know ourselves precisely what a decibel was!

So we started to delve into the dark world of decibels to make the blinking things easier to understand. We initially wanted to create an amazingly informative infographic to best explain how loud our air conditioners are. However, we didn’t know where the ‘cut-off’ point should have been and we got somewhat carried away until we found the worlds loudest noise!

Despite all of our in-depth research, noise levels and decibels are still controversial and subjective. We found so many different accounts of how loud the same sound was. Indeed, most of our research showed that an aeroplane taking off is louder than a spaceship launch and surely this cannot be the case. Further investigation revealed that people forget to mention how far away they were when actually measuring the sounds. Also, based in London, we don’t live close enough to Cape Canaveral to run around waving our own decibel meter…..

Have some fun clicking around on our all-singing-and-dancing infographic below. Those of you who wish for a more academic approach can scroll to the bottom to check out our initial research.

An audio infographic! This is a new way to create an interactive infographic. Each of the sounds listed in the infographic above is clickable to play an audio sample of each noise. It’s more fun and entertaining than actually representing the decibels because there’s no way your computer speakers (or your mobile phone speakers) can reproduce some of the decibel levels shown here. Plus you have volume control.

I’m really disappointed that the vertical scale is out of proportion. The sounds should be accurately placed along the decibel scale, not just evenly spaced no matter what the values are. That’s just poor data visualization.

There’s a sharing issue that happens with an interactive infographic like this one. I was bale to get the embed code from the publisher, so all of the click-to-play sounds should work here on Cool Infographics as well. However, most people that share the infographic will only grab the JPG image file or click the sharing buttons, and that loses all of the interactivity included in the code. The sounds also don’t work on many iOS and mobile devices.

What other infographic topics could include sounds?

Thanks to David for sending in the link!

Thursday
Dec042014

The Pianogram

The Pianogram Joey Cloud infographic

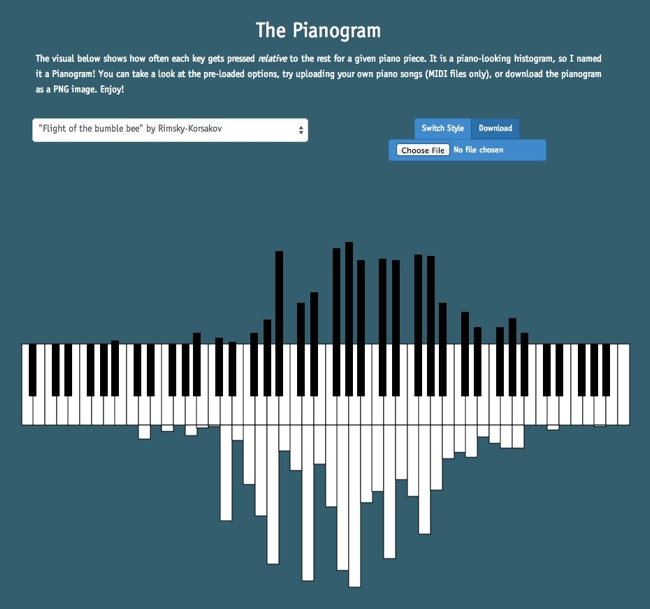
The Pianogram is a histogram using the design style of a piano keyboard to show the frequency of notes in a given song. Designed by software programmer Joey Cloud, the site has a handful of preloaded songs, but you can upload the MIDI file for any song to create a custom pianogram.

The visual below shows how often each key gets pressed relative to the rest for a given piano piece. It is a piano-looking histogram, so I named it a Pianogram! You can take a look at the pre-loaded options, try uploading your own piano songs (MIDI files only), or download the pianogram as a PNG image. Enjoy!

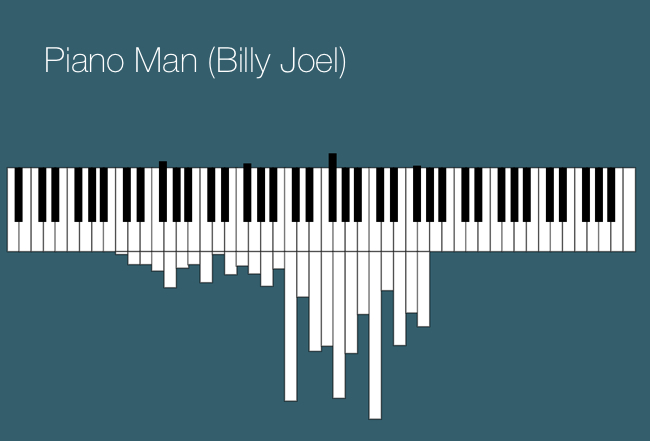
This a fun visualization tool. Here’s Billy Joel’s Piano Man, just because it seemed the most appropriate:


The Pianogram Billy Joel Piano Man

Found on FlowingData and FastCo Design

Wednesday
Dec032014

40 Brand Logos with Hidden Messages

40 Brand Logos with Hidden Messages infographic

Some of the best known logos hide the best kept secrets. 40 Brand Logos with Hidden Messages infographic designed by Oomph! reveals some of those secrets. How many did you already know?

You probably already know the story behind the famous FedEx logo and its clever use of negative space. (If you don’t, read this.) But of course, it’s hardly the only logo with a “hidden message.”

British plastic card maker Oomph has collected 40 such logos—check them out below. Amazon, Unilever and the Tour de France are particularly cool. How many of these sneaky messages would you have spotted without the help?

You can’t cover this topic without the visuals, and that’s why this infographic is so effective. It shows you the logos with clear explanations of the stories behind them.

The footer should include the uRL to the infographic landing page, so readers can find the original, full-size version when they find this design on other sites across the Internet.

Found on: http://www.adweek.com and http://www.thedrum.com

Wednesday
Nov122014

Responsive Web Design

Responsive Web Design infographic

When you have your own website, there are plenty of decisions you have to make. The Responsive Web Design infographic from Verve gives helpful information about why you need to to seriously consider upgrading to a responsive design for your web page.

Is your website optimised effectively for all devices and platforms? Don’t just think mobile or desktop, think every simgle device and user on the web. Responsive websites are designed to provide an optimal viewing experience across all platforms

Nice visuals and illustrations that explain how responsive websites work.

Thanks to Dave for sending in the link!

Tuesday
Oct212014

Where Do Designer Dogs Come From?

Where Do Designer Dogs Come From? infographic

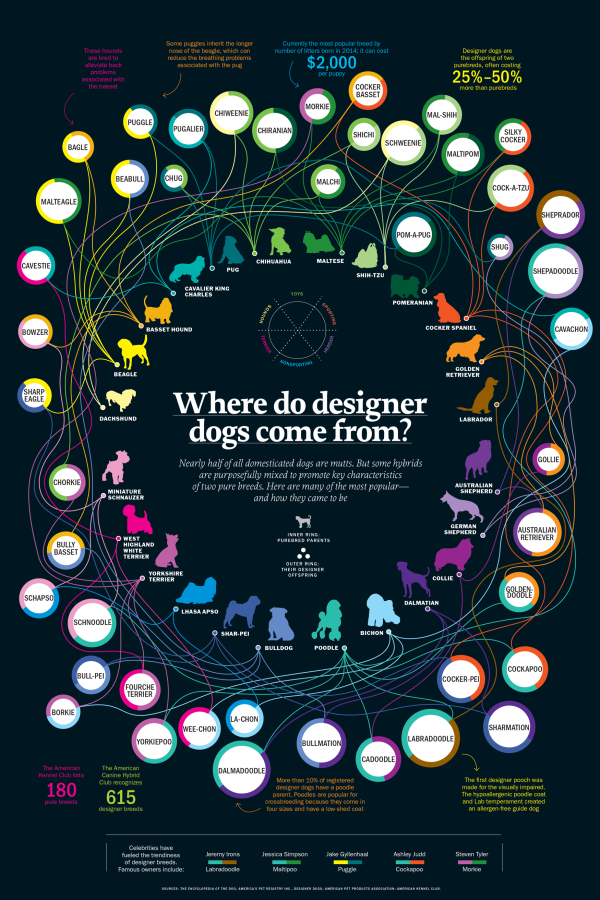
Where do Cocker Bassets come from? The answer is from a Cocker Spaniel and a Basset Hound! Where Do Designer Dogs Come From? infographic from Time explains the breeding patterns behind the multiple breeds of dogs.

Morkies. Cockapoos. Chiweenies. These dogs may not have serious names, but they’re a serious business. Known as ‘hybrid’ or ‘designer’ dogs, these canines are bred with a purpose – to optimize the best qualities of each parent.

Unlike some mixed breeds, designer dogs are generally born from two purebred parents. Depending on the qualities of the offspring, one puppy can be like having two dogs in one. Labradoodles, for instance, were first bred from labradors (which are common guide dogs) and poodles (with a low-shed coat) to be hypoallergenic service dogs. Puggles – a cross between a pug and a beagle – usually have a muzzle of a beagle, which can eliminate breathing problems often associated with the short-nosed pug.

Not all hybrids are desirable. Designer-dog critics says genetic experimentations are exacerbating the problem of puppy mills. For instance, when a puggle inherits a short snout from a pug and the hunting instincts from the beagle, it may not have a respiratory system that’s equipped to handle all the exercise it needs. These unwanted dogs often end up in shelters.

Despite the controversy, designer breeds have made a mark on the $60 billion pet market by commanding high prices that often exceed their purebred counterparts. And so long as the market continues to demand them, cavachons, pekeapoos and schnoodles are here to stay.

Bright, colorful network connections between breeds makes for a good infographic. curved, winding connections draw in readers to follow their favorite breeds.

The circle sizes have no meaning, just sized to fit the text within, which is misleading.  Disappointingly, the stats they do have are not visualized at all. The URL to the infographic landing page should be included in the footer so readers can find the full-size original version when they find this posted on other sites that don’t include a link.

Thanks to Sue for sending in the link!

Friday
Oct102014

5 Great Online Tools for Creating Infographics

Professional infographic designers rely primarily on a core vector graphics software program to create their infographics designs. The main advantage is that all the icons, charts, images, illustrations, and data visualizations are treated as separate objects that can be easily moved, resized, overlapped, and rotated. No matter where you create the individual design elements, the final infographic design is usually put together in a vector graphics program.

Creating infographics using online tools has never been easier. In the last few years a number of online tools have emerged that allow anyone to create great visual content.  Whether you are working on a project for work, personal use, or social media, each new project starts with a template. With the dimensions laid out for you, you can focus your attention on quickly creating effective designs. Search, drag, and publish - it can be that simple.

These new tools are vector graphics applications that run in your browser as a replacement for using an expensive professional desktop application like Adobe Illustrator to put your infographic design together.  Each one offers different tools, image libraries, charts, fonts and templates as a starting point.  None of these have the full capabilities of a professional desktop application, but you probably don’t need that much power to create a simple infographic.

In this article, we take a quick look at 5 of the best online tools for creating infographics: Visme, Canva, Easel.ly, Piktochart, and Infogr.am. All of these tools are evolving quickly, and this is just a snapshot of their current capabilities.
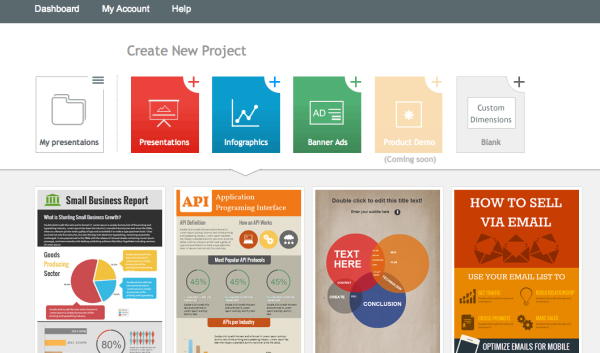
 

Visme screenshot

1) Visme (visme.co)

Visme allows you to create interactive presentations, infographics and other engaging content. With tons of templates, and huge library of free shapes & icons to choose from, Visme has you creating awesome visual content right away.

The templates are set up simply and beautifully. If you wanted, you could just edit the placeholder text, insert your own, and publish your infographic.

One of the greatest aspects of this service is changing percentages within the charts. All you have to do is click on the graphic you would like to change, enter a new number, and the chart changes to reflect the new information automatically. Saving you hours of frustration trying to do it on your own.

Pros:

  • Creates infographics, presentation, animations, ad banners, and custom layouts.

  • Insert and edit chart objects directly by changing the data values.

  • Large library of icons and images.

  • Embed YouTube videos directly into designs.

  • Special pricing for students & teachers.

Cons:

  • The basic free version is limited.

    • Only 3 projects.

    • Must include the Visme logo.

    • Limited access to charts and infograph widgets.

  • JPG download is still in Beta, with a few bugs.

Price: Basic version is free with pricing plans available
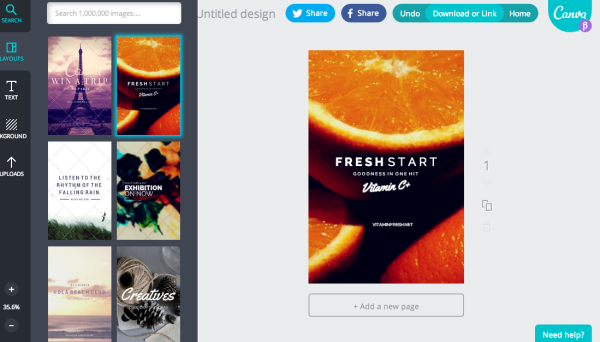
 

Canva screenshot

2) Canva (canva.com)

Canva just celebrated their 1-year anniversary last month, and has made a big splash in the online design space.  Your experience kicks off with a great "23 Second Guide to Beautiful Design," where they walk you through a brief introduction to their design program.

After finishing the brief tutorial, you can start a new design. Canva is filled with options, whether you are working on a project for work, personal, or social media. Each new project comes with a template for the project you choose to work on. With the dimensions done for you, you can focus your attention on creating beautiful designs in seconds.

Pros

  • Excellent (and short) intro tutorial to get you started, and many more on advanced concepts.

  • Templates for social media, blogs, presentations, posters, business cards, invitations, and more.

  • Easy and intuitive to use.

  • Large library of images to choose from.

Cons

  • No editable chart objects. You need to import your own data visualizations as images.

  • Have to pay for different image assets individually, instead of a monthly subscription.

Price: Free, but you have to pay for Pro quality design assets individually
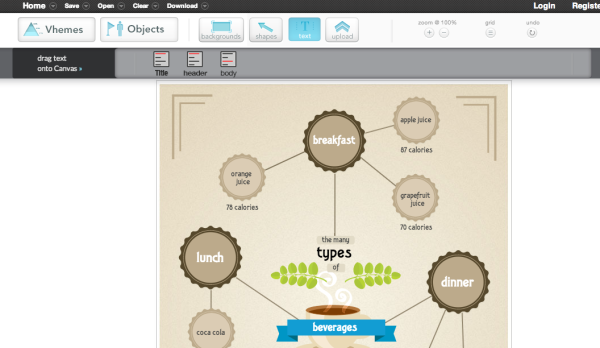
 

Easelly screenshot

3) Easel.ly (www.easel.ly)

Easel.ly is a great program, but lacks some of the guidance, and features, that come standard in other programs.

Easel.ly lacks a "How-To" introduction section to their program, and just kind of throws you into the design process right away. Their focus seems to be primarily based on infographic design. Whereas other programs offer a plethora of design project options.

If you're just looking to design an infographic, this program will work well. If you want more variety, you'll have to utilize one of the other programs in this list.

Pros:

  • Free.

  • Very basic design layouts and assets.

  • New charts feature allows some basic editable charts in your design.

  • Easy downloads for JPG and PDF versions.

Cons:

  • Not a very large selection of themes, called “Vhemes”.

  • Small library of image assets. You’ll want to upload your own images and icons.

Price: Free
 

Piktochart screenshot

4) Piktochart (piktochart.com)

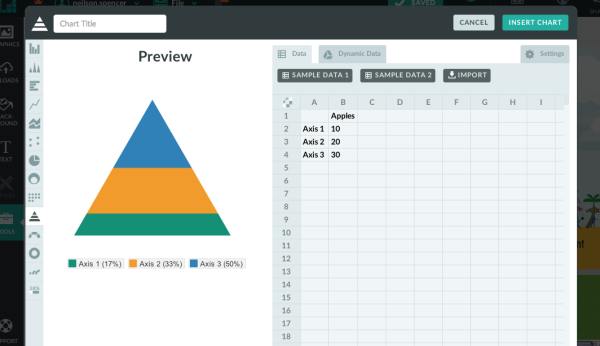
Piktochart is one of the best looking programs on this list. All the information you need to get started is provided in their tour.

Their program is easy to use, and offers tons of freedom in building and editing your infographic using their simple graphic tools. They have categorized icons, resizable canvas, design-driven charts, and interactive maps to utilize.  

Their intuitive user interface is where Piktochart truly excels. All the tools you need to create are laid out intelligently, making your new job as a "designer" so much easier.

One of the coolest aspects of this program is that they show how versatile infographics are for different projects. Whether you're creating for a classroom, office, website, or social media setting - Piktochart gives you the heads up on how to use infographics effectively.

Pros:

  • Themes and templates are of high design quality.

  • Intuitive. Allows you to edit anything and everything with ease.

  • Create infographics, reports, banners and presentations.

  • Embed videos from Youtube and Vimeo in your design.

Cons:

  • Limited selection of free templates. Higher quality templates are available with a Pro account.

  • $29 per month is a high subscription price compared to the others.

Price: Start for free with pricing packages available
 

Infogram screenshot

5) Infogr.am (infogr.am)

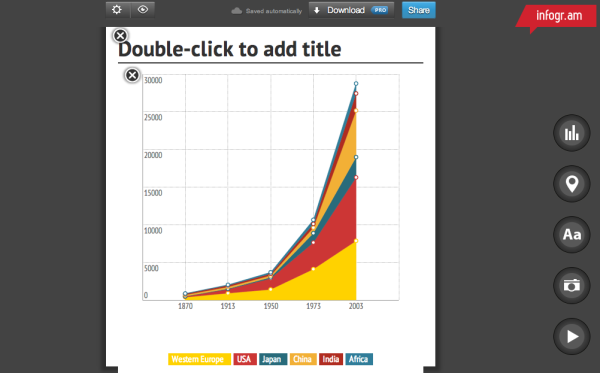
Infogr.am has got the best charts. For illustrating data, there are more than 30 different types of charts to choose from. Anything from bubble charts and tree maps to simple pie charts.

Editing data can be easily done in Infogr.am's built-in spreadsheet, or you can import your own XLS, XLXS and CSV files.  Once your infographic has been edited and beautifully designed, you can save it to your computer as a PNG or PDF file with a paid subscription.

Pros:

  • Ability to create and edit great charts by changing data

  • Built-in Spreadsheet. Can also import your XLS, XLXS and CSV files

  • Widest variety of available chart types

  • Educational and Non-profit pricing plans available

  • Embed videos from Youtube and Vimeo in your design.

Cons:

  • Only creates infographics and charts

  • Small selection of infographic templates

  • No image library, you must upload your own image assets

  • Download options require paid subscription

  • The White Label subscription service is the most expensive options of the group

Price: Basic version is free with pricing plans available


Which design sites have you tried? Which tools are your favorites? Post in the comments.

Friday
Oct032014

The Graphic Continuum

The Graphic Continuum data visualization poster

The Graphic Continuum is a new poster of data visualization styles and methods from Job Schwabish and Severino Ribecca. Available as a printed poster for $25 on Mimeo.

The Graphics Continuum shows several ways that data can be illustrated individually or combined to show relationships. Use of various shapes, chart types, and colors can help identify patterns, tell stories, and reveal relationships between sets and types of data. Bar charts, or histograms, for examples, can illustrate a distribution of data over time, but they also can show categorical or geographic differences. Scatterplots can illustrate data from a single instance or for a period, but they also can be used to identify a distribution around a mean.

This set of charts does not constitute an exhaustive list, nor do the connections represent every possible pathway for linking data and ideas. Instead, the Graphic Continuum identifies some presentation methods, and it illustrates some of the connections that can bind different representations together. The six groups do not define all possibilities: Many other useful overlapping data types and visualization techniques are possible.

This chart can guide graphic choices, but your imagination can lead the way to other effective ways to present data.

The Graphic Continuum data visualization poster closeup 1

I’ve seen a few other attempts to gather and categorize data visualization techniques, and I really like this poster. One of the biggest challenges for people is to break out of the Big Three chart styles: bar charts, line charts, and pie charts. It doesn’t matter if they’re designing an infographic or a PowerPoint presentation, I am often asked to help clients find new ways to visualize their data.

The Graphic Continuum data visualization poster closeup 3

Jon Schwabish has posted a great article on Visual.ly about the development process and includes images of some other arrangements they attempted during the design process.


Tuesday
Sep162014

Beer Colors

Beer Colors Cans Visualization Infographic

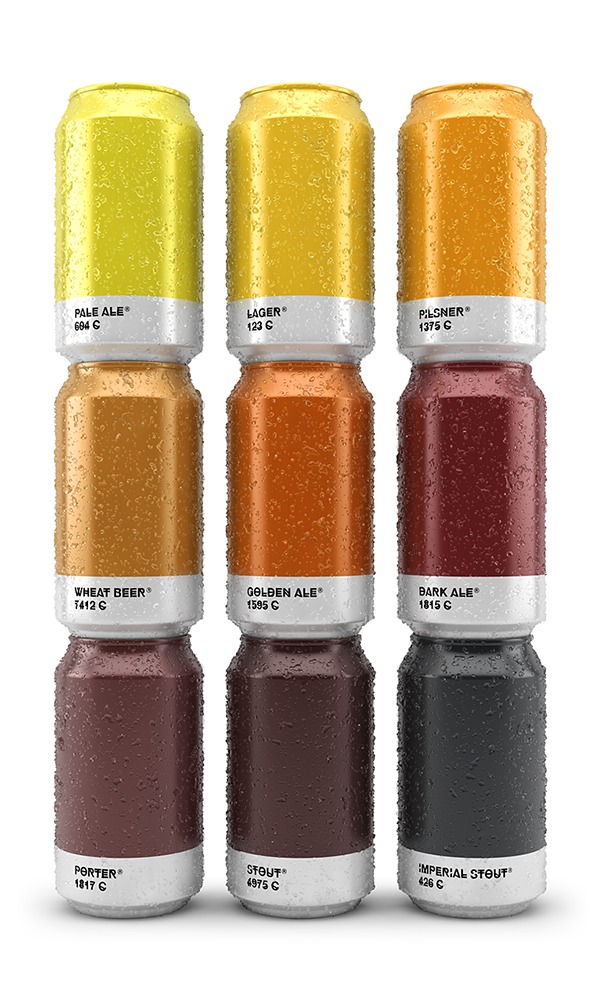
Beer colors is a fun design idea that combines packaging design with beer label design, these beer label designs imitate Pantone® color chips.  Maybe more of a data visualization of colors than a true infographic, but I love it!

Concept and design based on the color of the beer. Each type of beer is associated with its corresponding Pantone color. The typeface chosen is HipstelveticaFontFamily in its bold version by José Gomes, thanks for sharing.

Designed by Spanish creative agency Txaber, this series of beer packaging labels show each brew type represented by its corresponding official color. 

Beer Colors Bottles Visualization Infographic

Found on creativebloq and BoingBoing