About
Randy Krum
President of InfoNewt.
Data Visualization and Infographic Design

Infographic Design

Infographics Design | Presentations
Consulting | Data Visualizations

DFW DataViz Meetup

Join the DFW Data Visualization and Infographics Meetup Group if you're in the Dallas/Fort Worth area!

Search the Cool Infographics site

Custom Search

Subscriptions:


Feedburner

The Cool Infographics® Gallery:

How to add the
Cool Infographics button to your:

Cool Infographics iOS icon

- iPhone
- iPad
- iPod Touch


Read on Flipboard for iPad and iPhone

Featured in the Tech & Science category

Flipboard icon

Twitter Feed
From the Bookstore

Caffeine Poster

The Caffeine Poster infographic

Entries in design (479)

Thursday
Sep042014

Abby & Chris: Wedding Invitation

Abby & Chris: Wedding invitation

Another fun way to spruce up your life with visuals! The Abby & Chris Wedding invitation from Abby Ryan Design takes an ordinary wedding invitation, and makes it extraordinary with data v visualization Fun idea! Maybe try it out for your next party?!

Abby & Chris: Wedding invitation

This illustrative wedding package was designed to reflect the playfulness of Abby and Chris’s food truck wedding. First, a 18 x 24 screen printed wedding infographic that works as an invitation, program and menu. The poster was designed with the rehearsal dinner invitation as the bottom section so it could be removed for guests only coming to the wedding. Next, the save the date card, which focuses on important events in Abby and Chris’s relationship with the final date being their wedding. A wedding website was also created to keep their guests informed.

This is fun and original. A keepsake for all the guests! It also gives a lot more useful information than most wedding invitations!

Thanks to Abby for sending in the link!

Friday
Aug292014

False Visualizations: Sizing Circles in Infographics

Accuracy is the most important aspect of an infographic design!

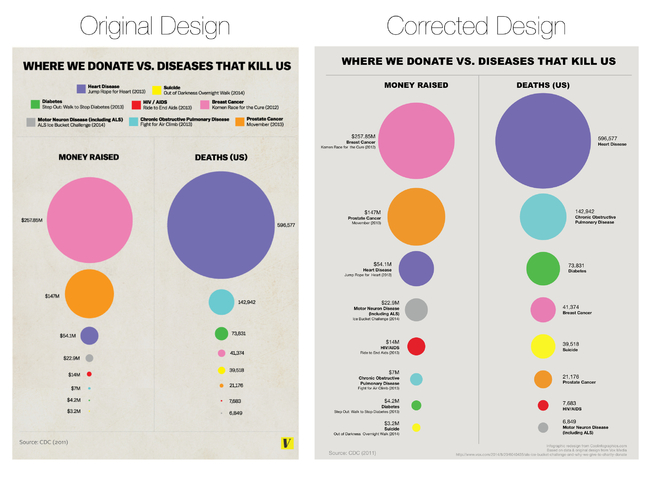
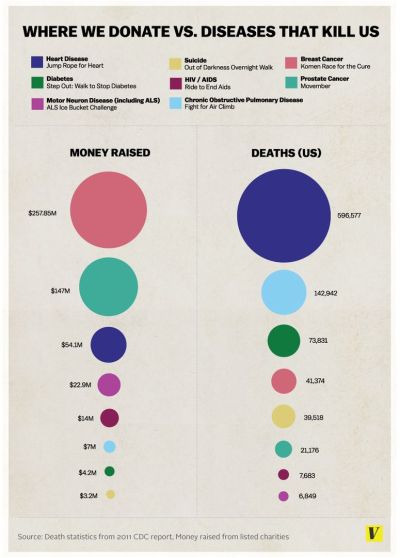
Last week, the article The Truth about the Ice Bucket Challenge by Julia Belluz on Vox Media included the infographic, Where We Donate vs. Diseases That Kill Us, that used proportionally sized circles as its data visualization. The problem with this design is that the circle sizes don’t match the values shown. This is a false visualization and significantly over exaggerates the smaller amounts of money contributed to each charity and the deaths attributed to each cause.

This causes problems because readers often just look at the visuals without reading the actual numbers. They start with the assumption that a visualization accurately represents the data. The Vox Media story and infographic already have over 12,000 shares on Facebook, and this is a great case study for designers to understand how important it is to visualize data accurately.

As readers, we see the area of two-dimensional shapes on the page to represent the different values, but design software only allows width and height adjustments to size shapes. Designers make the mistake of adjusting the diameter of circles to match the data instead of the area, which incorrectly sizes the circles dramatically. It takes some geometry calculations in a spreadsheet to find the areas and then calculate the appropriate diameters for each circle. To demonstrate, I created this corrected version of the infographic.

False Visualizations: Sizing Circles in Infographics Revised

My Google Docs spreadsheet of the correct circle area and diameter calculations is available here.

Assuming this was a design mistake, and there was no intent to deceive the audience, this is a common mistake that many designers make.  So many designers, that I included an entire section on this topic in the Cool Infographics book to help designers understand how to size the area of circles.

I made one other improvement to the corrected design above by removing the color legend and listing the charities and causes of death right next to the appropriate circles. This makes the whole visualization easier for the audience to read by eliminating the need to look back-and-forth from the circles to the color legend to figure out what each circle represents.  Placing the text next to each circle keeps the information in the reader’s field of view which minimizes eye movement.

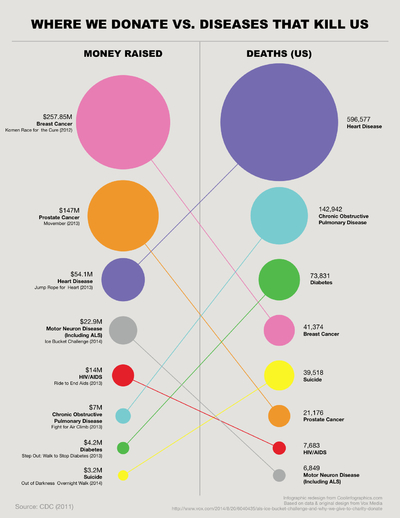
Sticking with the circles data visualization style, I wanted to take the design a little bit further. I would recommend one of two alternate improvements.  First, adding colored connecting lines is one way to make it easier for the audience to find the related circles in the columns sorted in descending order.

False Visualizations: Sizing Circles in Infographics Revised Lines

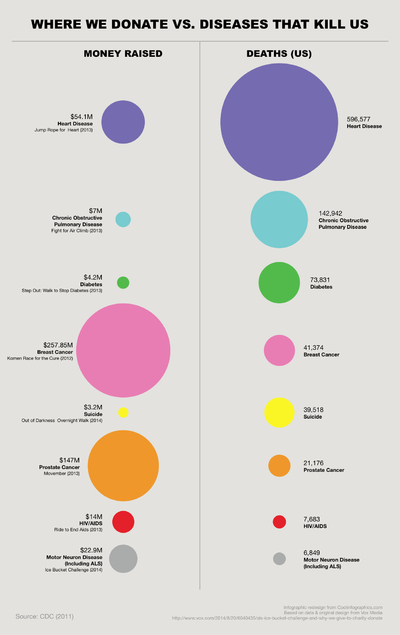
A second alternative would be to sort the lists to line up the related circles.  This makes it much easier for the audience to see the direct comparisons between charitable contributions and death rates related to the same cause.

False Visualizations: Sizing Circles in Infographics Revised Descending Sort

I’m passing over any discussion about whether using proportionally sized circles (a bubble chart) is the best visualization method for this data. If a designer makes the choice to use sized shapes, my point is that the data visualizations in the infographic must match the numbers using area.  David Mendoza published a good analysis worth reading and designed an alternative way to visualize the data in his article, This Bubble Chart Is Killing Me.

How else would you improve this design?

NOTE: I was able to contact the designer who created the infographic at Vox Media, and he had already realized his error after the infographic had been published. As I had guessed, he had mistakenly adjusted the diameter of the circles instead of the area. He told me that he’s working on updating the official infographic design in the article, but it hasn’t been published on the Vox Media site yet.


Tuesday
Aug122014

The Vizzies Challenge

The Vizzies Challenge

A partnership between Popular Science and the National Science Foundation (NSF) have started a new data visualization contest for 2014 called The Vizzies Challenge.  They are accepting entries up until September 30, 2014.

Here at Popular Science, we’re big fans of visualizations—those often beautiful and always illuminating intersections of science and art. So we’re thrilled to announce a new partnership with the National Science Foundation called The Vizzies.

Do you love animating data, creating science apps, or taking macrophotographs? In the 2014 Visualization Challenge, sponsored by the National Science Foundation and Popular Science, your handiwork can receive its due glory and win you cash prizes.

The Vizzies is the newest iteration of the NSF’s annual International Science and Engineering Visualization Challenge, which has honored some amazing stuff in the past. They’ve hosted the contest for more than a decade, and this year we’ve joined forces with them so that you, dear reader, will have the opportunity to enter. Macrophotography, animations, data visualizations, even science games—we want them all! A panel of experts will judge the entries, and the winners in each of five categories will be featured in the pages of Popular Science (oh, and you’ll also get cash).

Visualization Challenge participants can submit their entries in one or more of five categories: Photography, Video, Illustration, Posters & Graphics and Games & Apps. The Experts’ Choice winner in each category will be awarded $2,500, and a People’s Choice prize of $1,000 goes to the best overall entry.

If you are designing data visualzations or using visuals to communicate any scientific research, they want you to enter your designs into the challenge.  The visuals can be videos, photos, games, apps or graphics.

Thanks to  for posting about the challenge in the Visual Thinking group on Linkedin!

Thursday
Jul102014

The Ultimate Guide to the Moustache

The Ultimate Guide to the Moustache infographic

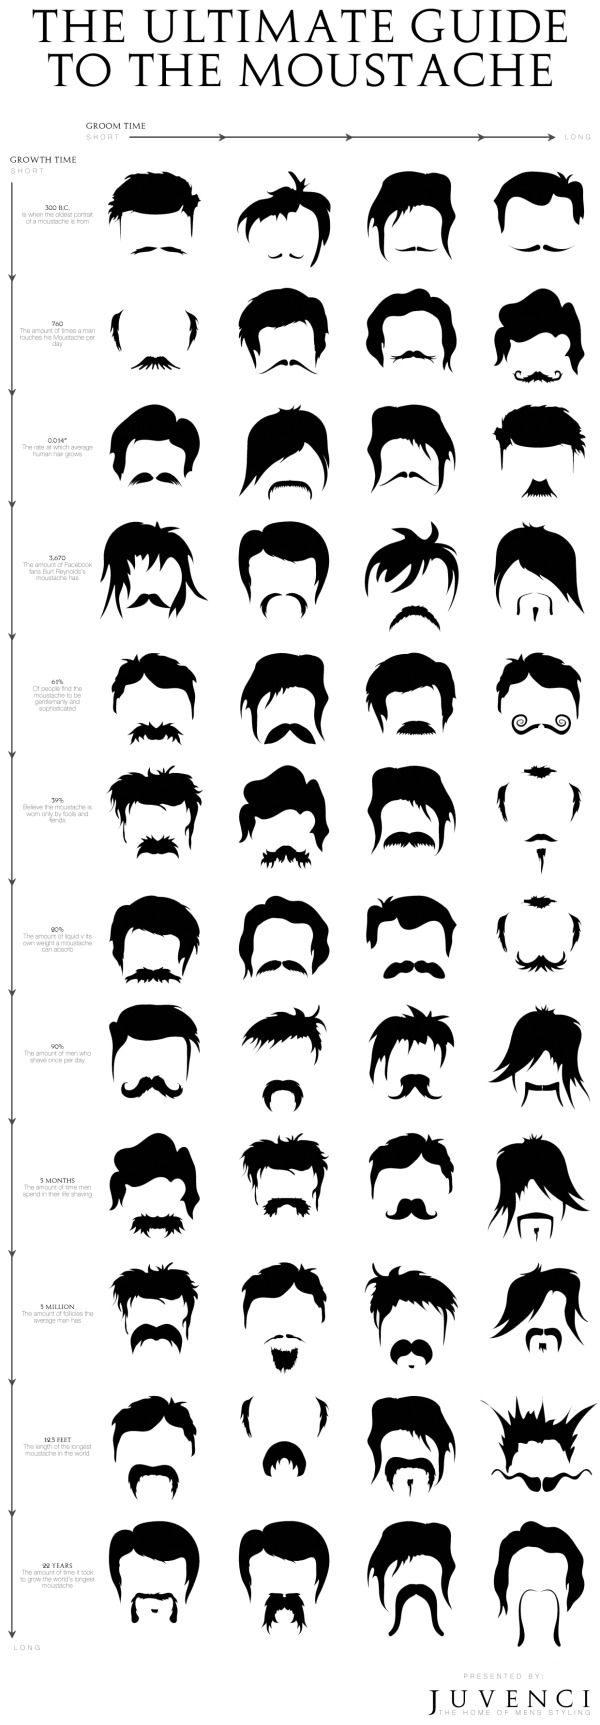
I moustache you a question. How do you pick your facial hair style?! The Ultimate Guide to the Moustache infographic presented by Juvenci balances length with groom time. Find out where you are on the spectrum!

We have just finished working on our ultimate guide to the moustache! It features 48 moustache styles sorted by a groom time v growth time matrix (with some fun moustache facts thrown in there too!).

This is a fun little graphic that brings style into the daily struggle of a man with his moustache.  The infographic design needs to include the infographic’s URL at the bottom of the graphic so that people can find the original.

Thanks to Conner for sending in the infographic!

Tuesday
Jun242014

HelpMeViz: DataViz Community Feedback for Your Charts

HelpMeViz: DataViz Community Feedback for Your Charts

Have you ever struggled with which type of chart to use in your presentation? Or how to get Excel to display the chart the way you want it to appear?  Or don’t know what software will create the data visualization you would like to use?

Jon Schwabish is a data visualization specialist, and in 2013 he launched a new website to help everyone become better at data visualization called HelpMeViz.  The HelpMeViz site invites you to submit your data visualization projects to get feedback from the community.  The community is encouraged to offer suggestions, critiques and debate ideas about chart formats, software tricks, visual applications and visualization methods that can be valuable feedback to make your data more understandable and impactful.


The data visualization community consists of people who use data and design to tackle a variety of issues and challenges. Outside of a few specific blogs and tutorials however, there isn’t a place where that community can provide in-depth comments and criticism on data visualization projects. This site is designed to facilitate discussion, debate, and collaboration from the data visualization community.

The site is open to anyone who is searching for feedback on their visualization designs, from seasoned designers and data visualization specialists to individual analysts searching to improve their graphic displays. All types of visualizations are welcome: simple, single line or bar charts to full-blown infographics to interactive visualizations.

If you have a chart that just isn’t working, or getting your message across to your audience, you can upload it to the site, and get really useful, actionable advice from the Community.
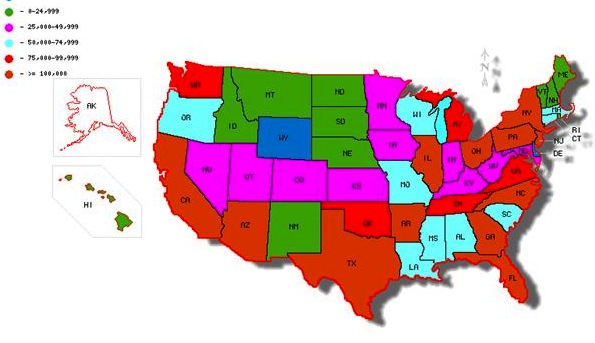
Mapping Program Participation by State

Jon is currently the Senior Researcher and Data Visualization Expert at the Urban Institute in Washington, DC, and he took some time to answer a few interview questions from me about the HelpMeViz site:

Cool Infographics: Who is the target audience of the site?

Jon Schwabish: The site was created for anyone—truly anyone—to seek feedback or submit comments. I want anyone to be able to use the site—from the data visualization expert to the experienced JavaScript programmer to the research assistant using Excel. To attract that broad audience, I decided against using established tools or sites like Flickr, Pinterest, Behance, or Dribbble. Many of those sites require users to create an account, or have some other barrier to easy entry and I wanted to avoid those types of barriers. Additionally, I felt that sites like Stack Overflow and GitHub appeared too difficult for the everyday user. So, although it’s often said that you should refine your audience, I wanted to go broad here to make it as accessible as possible.


Cool Infographics: How often do people post new visualization questions to HelpMeViz.com?

Jon Schwabish: To date, I’ve posted at least one visualization per week. There have been a few weeks when I’ve been able to do more. Interactive visualizations and ones that have a unique design question—for example, how to create something in Excel—generate the most interest.


Cool Infographics: Are you having success getting the audience to engage and recommend design ideas?

Jon Schwabish: For the most part, I haven’t had to engage the audience much on my own; community members have taken most of the initiative to engage with the content, making light work for me on that end. I’d like to see more requests on the design side—questions about font or color or layout. To date, requests have been primarily about tools and creation of the visualization. But I think a lot of people would benefit from asking basic design-style questions.


Cool Infographics: Does it take much of your own time to participate and keep the site running?

Jon Schwabish: It doesn’t take too much of my own time, but that will change, I hope, as the amount of content increases. I oftentimes have to rewrite the text to clarify the challenge or goal. Sometimes I need to tweak an image or extract an image from a larger document. I rarely fiddle with the data—if the person who submitted the visualization could use it to create the graphic, then it’s probably close enough for others to use. I’ll usually correspond with the submitter once or twice to make sure he or she is okay with my edits and then I post the submission.


Cool Infographics: What are the best examples of successful projects posted to the site?

Jon Schwabish: There have been a number of interesting challenges.

Perhaps the thing I’m most excited about for the site right now is the live Hackathon that will be held on Saturday, June 28, with Bread for the World Institute. We are inviting 25 coders, designers, and data scientists to help the Institute with two data visualization challenges. I will be live blogging the event and will make the data available on the HelpMeViz site so that anyone around the world can join the discussion and provide his or her own visualization suggestions.

This site is truly made for everyone, and I encourage you to check it out.  The feedback can range from Excel charting tips to visualization programming code.  You can upload your own charting challenges, offer recommendations on other people’s charts or just lurk and learn from the advice of other experts.

If you’re in the DC area, be sure to check out the HelpMeViz Hackathon event on Saturday, June 28th! HelpMeViz will bring together coders, data scientists, and data visualizers in Washington, DC, to help Bread for the World Institute with two data visualization challenges for its 2015 Hunger Report, which focuses on why women’s empowerment is essential to ending global hunger.

Thanks to Jon for creating this incredible resource, and taking the time to answer a few questions!

Wednesday
Apr092014

Color: Profiles & Printing Explained

Color: Profiles & Printing Explained infographic

It is frustrating when you go to print an image and it doesn’t look right. Color: Profiles & Printing Explained infographic from The Logo Company explains the differences between CMYK, RBG, and Pantone as well as when to use them.

Whether you are printing a single logo or a full promotional brochure, you want your marketing products to look sharp. Given this, it is important to understand the science behind color creation and printing techniques, so you can make educated decisions about how to produce the best images for every project.

To keep your logo and other imagery looking bright and vivid, there are three basic color profiles with which you should become familiarized. What works for your web page will not necessarily work for printed postcards. Choosing the right color profile is the essential first step in creating a beautiful image.

A bright, colorful infographic design almost always grabs the audience’s attention, and this design does a great job of showing the readers the differences between color profile methods.

On the infographic landing page, the infographic image is actually below all of the more-detailed text descriptions, and readers have to scroll down to see that there is an infographic at all.  The image should be at the top of the page with the additional text below to add more detail for readers that want the additional information.

The footer should include the URL to the infographic landing page so readers can find the original, full-size version, and also a copyright or Creative Commons license.  How are people allowed to share and/or modify this design?  Could another printing company put their logo on the design and publish it?  It’s not clearly stated.  A standard copyright license is assumed, which would not allow other companies to modify the design, but it really should be explicitly protected.

Thanks to Matt for sending in the link!


Monday
Feb242014

How to Create Beautiful Calligraphy

How to Create Beautiful Calligraphy infographic

Calligraphy is a skill that requires a lot of practice. But no amount of practice will help you if you don’t have the right tools. The How to Create Beautiful Calligraphy infographic from Moo explains everything that you need to be successful. From the tools you need, to how to actually do each letter.

The graphic is a step-by-step guide to creating your own stunning hand-drawn calligraphy, and explores everything from the tools and materials you need, to how to draw the perfect curve with your nib.  The design very clearly walks the audience through the sequence of information using illustrations to enhance each point.

The text is a little bit too small when the infographic is sized to fit within a blog post (usually 600 pixels wide, as you can see above), but that can also have the benefit of encouraging readers to click through to see the original full-size version on the Moo site.

The footer of the infographic should include a copyright statement (or Creative Commons) to clearly outline the rights for sharing that the publisher wants to allow online.   Also, the URL to the original infographic landing page on the Moo site would be very helpful.  Currently it is very hard to find on the Moo site, and is not included in any blog posts that I could find.  Including the URL in the infographic image itself ensures that readers will be able to find the orignal even when the infographic is shared in social media without a correct link back to the original.

Thanks to Dan for sending in the link!

Tuesday
Feb112014

The "Perfectly Optimized" Page

 The Perfectly Optimized Page infographic

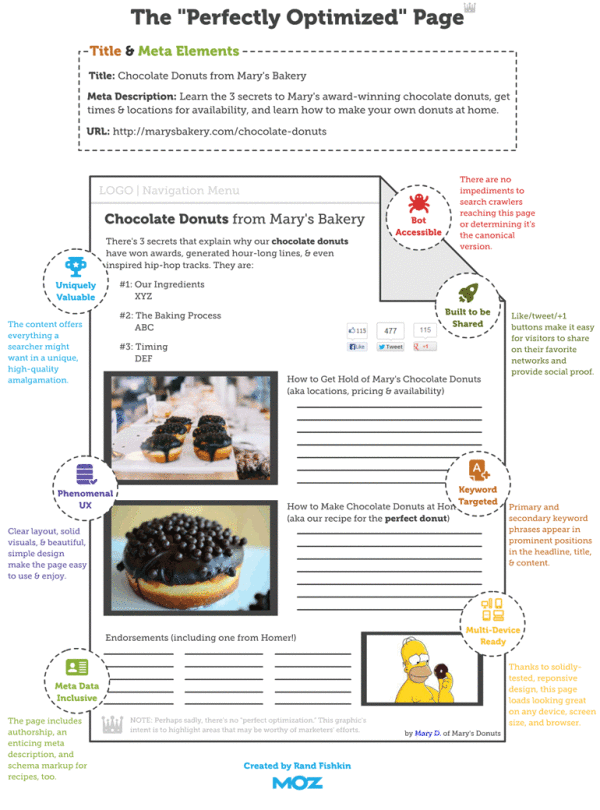
The “Perfectly Optimized” Page infographic states that there is no such thing as a “Perfect Page”. But don’t be discouraged! Moz.com presents 3 key points to be followed to increase user happiness and outreach.

One important takeaway from this post should be that modern on-page SEO is about juggling competing priorities. In general, my recommended ordering of those priorities is as follows:

  1. Create a page that is uniquely valuable to your targeted searchers.
  2. If at all possible, make the page likely to earn links and shares naturally (without needing to build links or prod people).
  3. Balance keyword targeting with usability and user experience, but never ignore the critical elements like page titles, headlines, and body content at the least.

There’s no such thing as a “perfectly optimized” page, but I took a stab at drawing up the mythical beast anyway.

Over time, what’s “perfect” might change, and new services, platforms, and areas of optimizational opportunity could arise. But for the past few years (notwithstanding some newer tactics like Google’s rel=author), the model described in this post has held relatively stable. The “O” in SEO is getting broader, and I think that’s a wonderful thing for marketers of all stripes. Targeting an algorithm instead of people is far worse than hitting both birds with the same handful of optimization stones.

This is a great us of infographics and data visualziations as part of a larger article.  The infographics can stand on their own and be shared online, but also fit inn perfectly with the text article.  This specific design is more of a blueprint diagram without showing and data, but has been very popular by itself.

Found on Hubspot.com and Hombrehormiga1

Thursday
Jan302014

Cool Infographics: Best Practices Group on LinkedIn

Cool Infographics LinkedIn Group

I am excited to announce the launch of a new LinkedIn Group, Cool Infographics: Best Practices. I have personally been a part of many great discussion groups over the years and believe that this group fills an unmet need.  Please accept this invitation to join the group to share your own experiences and wisdom.

There are many groups that share infographics, but I felt that a discussion group dedicated to the craft of infographics and data visualization was missing.  This group will feature questions and case studies about how companies are leveraging infographics and data visualization as a communication tool.  Any posts that are just links to infographics will be moderated to keep the focus on engaging discussions.  Topics and questions from the Cool Infographics book will also be discussed.

Join us in a professional dialogue surrounding case studies and strategies for designing infographics and using them as a part of an overall marketing strategy.  We welcome both beginning and established professionals to share valuable tactics and experiences as well as fans of infographics to learn more about this growing field.

-Randy


Friday
Nov082013

Apple Release Patterns

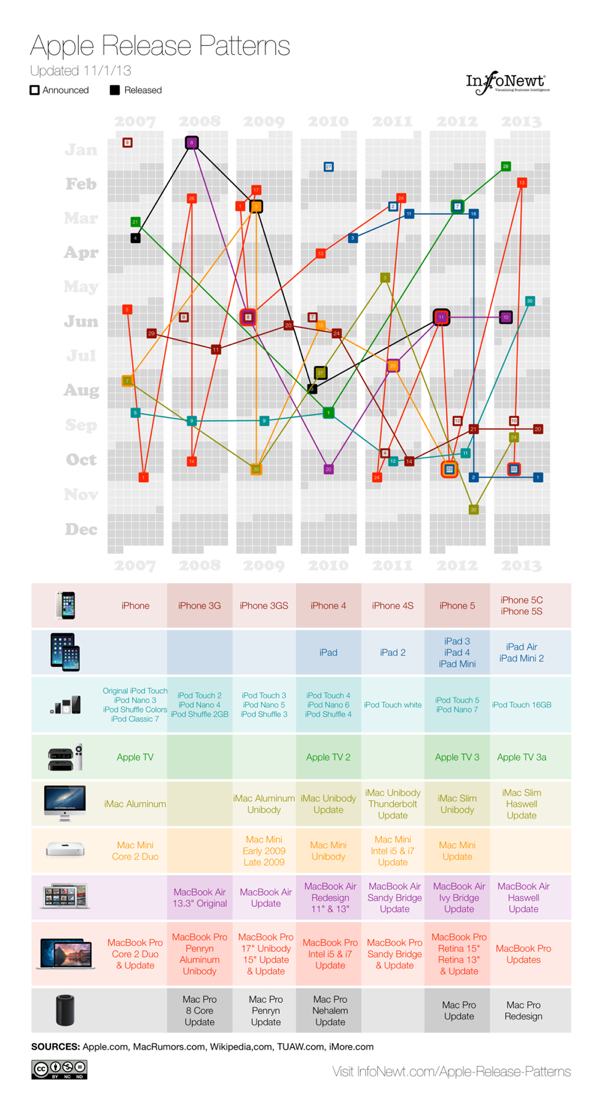
Apple Total Release Patterns infographic

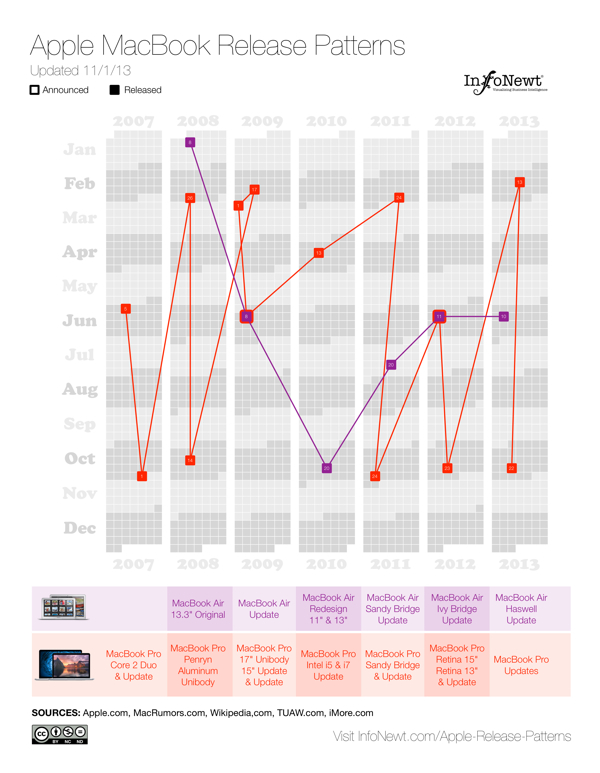
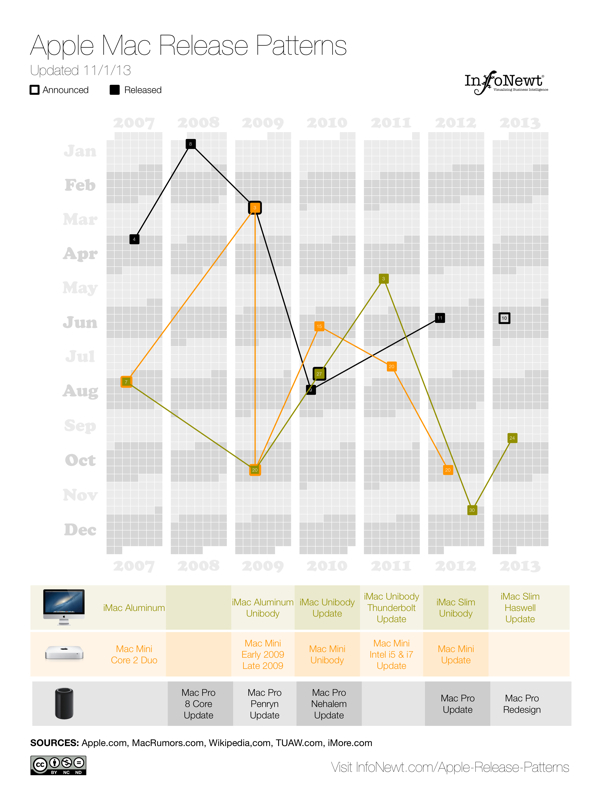
Apple Release Patterns is a new personal project of mine, and you can find the full-size original versions on a new, dedicated landing page on the InfoNewt.com site.  Every few months Apple releases a new product update or redesign, and the rumors start flying about what the upcoming product will be during the preceding weeks.  For better or worse, those speculations are often based on what was released in the same timeframe the prior year.

This data visualization lines up vertical columns for each year, starting with 2007.  I decided that anything further back wasn’t really relevant to Apple’s current practices.  Each product release is then mapped onto the calendar, showing a pattern (or lack of pattern) to the product releases.  If the product announcement was separate from the actual release date, I mapped that date as well.

This data was ripe for a visualization.  When I tried to look at the historical dates of product releases, the information was scattered across multiple sites, confusing and difficult to gather.  Some information was contradictory, which required further investigation.  So, the data topic itself was a good target for a clear, easy-to-understand visualization.  However, the design with all of the products was too complicated visually to perceive any defining patterns.  So, I created separate versions that break out the products into 3 categories, and those are much easier for readers to see the patterns.

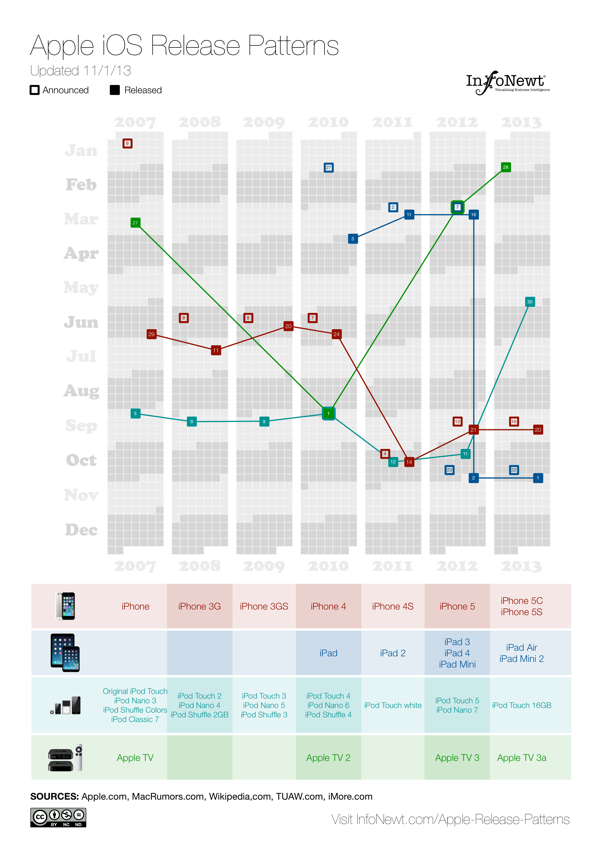
Apple iOS Release Patterns infographic

For iOS devices (iPod, iPad, iPhone and AppleTV) you can see the pattern shift in 2011 for most of the products to a Fall timeframe.  You can also see a recently consistent announcement date with the product release the following Friday.

Apple MacBook Release Patterns infographic

For Apple’s laptop line, the MacBooks, you can see the MacBook Air has become a regular release during the Worldwide Developers Conference (WWDC) in June, and the MacBook Pro gets fairly regular updates twice a year, usually just to update the internal specifications.

Apple Desktop Mac Release Patterns infographic

The desktop Mac line doesn’t seem to show much pattern at all.  They might get an update each year, but the timing is erratic.  Sometimes they are part of WWDC, sometimes part of the Fall iOS events, and sometimes completely on their own.

I’m going to keep updating these on the landing page as Apple releases new products in the future (upcoming iPad Mini 2 Retina and Mac Pro still need to start shipping this year).  I want these to become a valuable resource every time the Apple rumor mill heats up about the next product announcement.  If you use the embed code on the Apple Release Patterns landing page, your site will also display the updates automatically as they become available.

This is version 1.0.  I have some ideas and improvements I want to make in future versions, but I would love to hear your thoughts as well.  Post any suggestions or feedback in the comments below.