About
Randy Krum
President of InfoNewt.
Data Visualization and Infographic Design

Infographic Design

Infographics Design | Presentations
Consulting | Data Visualizations

DFW DataViz Meetup

Join the DFW Data Visualization and Infographics Meetup Group if you're in the Dallas/Fort Worth area!

Search the Cool Infographics site

Custom Search

Subscriptions:


Feedburner

The Cool Infographics® Gallery:

How to add the
Cool Infographics button to your:

Cool Infographics iOS icon

- iPhone
- iPad
- iPod Touch


Read on Flipboard for iPad and iPhone

Featured in the Tech & Science category

Flipboard icon

Twitter Feed
From the Bookstore

Caffeine Poster

The Caffeine Poster infographic

Entries in history (262)

Thursday
Jul072011

Bye Bye Space Shuttle infographic

I really like An Uncertain Future, a tribute infographic for the Space Shuttle program’s last launch of Atlantis scheduled for Friday.

Designed by for the Washington Post

Last week I published what could be my very last Space Shuttle infographic. As a space exploration enthusiast and a professional visual artist, NASA’s spacecraft will be sorely missed. Over the years, the Shuttle was the focal point in many of the most fun projects I’ve been involved, directly or indirectly.

I really like the arc timeline.  Not only is it a different design than you usually see, but it also indirectly implies the flight paths of the shuttles up into space and back down to Earth.

Found on Visual Loop

Monday
May302011

The History of Memorial Day #infographic


Appropriate and timely for the holiday today in the U.S., imortuary.com brings us I Remembered A Vet Today infographic about the history and ways to commemorate Memorial Day.

Memorial Day is commemorated in many ways to show respect for those who have died for serving our country.  Whether visiting a national cemetary or gathering with friends and family, take time to participate in the National Moment of Remembrance at 3 p.m. local time to observe a moment of silence.

Designed by the team at KillerInfographics.com.  Thanks to Charlie for sending in the link!

Thanks to all of our troops!

Wednesday
May252011

Apple Approves 500,000 Apps...and counting


To celebrate Apple (unofficially) reaching the 500,000 apps milestone, 148Apps, Chillingo and Chomp got together to create an infographic.  The 500,000 Apps infographic uses a cool blend of visual styles to explore the history of Apple’s App Store.

Early this morning, Apple approved app number 500,000.  For that, we salute the hard working developers and the enthusiastic community of app seekers (you!).

Because Chomp wouldn’t be here without all of these glorious apps plus our amazing community of app seekers, we’ve put together an infographic highlighting an array of app milestones along the way, including apps you’ve loved since the beginning.

Pie chart, timeline, bar chart, area chart, doughnut chart, stacked area chart and plain old BIG NUMBERS combine together to tell the story of the Apple App Store.

I’m disappointed that the data sources aren’t listed on the infographics.  That opens up the discussion to challenge the numbers and the validity of the overall infographic.

Cool design by Stefanie Kraus (@stefaniekraus)

Three cheers for Team Chomp member, Stefanie, who is responsible for ‘beautifying’ all of the 150+ data points into what is now being dubbed the longest (and most stunning) infographic you may ever see. 

Don’t worry Stefanie, I’ve seen LONGER infographics…


Found on The Unofficial Apple Weblog

Wednesday
Mar092011

The Present and Future State of Music

A State of the Art, The Present and Future State of Music (long title, I know) from 3GM.hu looks at the current statistics behind music streaming and consumption.

Personally, I can’t believe the statistic that 85% of listening is still consumed from the Radio?!?  I haven’t listened to an actual radio station for years!  I listen to everything through my iPhone.

Thursday
Mar032011

The Infographic History of SxSW

To help commemorate the 25th birthday of the South by Southwest (SxSW) conference this year, Eloqua teamed up with JESS3 to create this huge circular timeline.  Memorable moments and events are described around the outside, while the attendance of the three main conference topics (music, film, interactive) are visualized in the middle.  It was so large, i had to drop it into Zoom.it to make it interactive.  You can download the high-resolution PDF file here.

we collaborated with design partner JESS3 to produce an infographic, titled “The History of SXSW,” which celebrates the festival’s impact on the cultures of music, film and technology.  We also dug up (and visualized) a massive number of did-you-know facts about the epic festival.

SxSW started in 1986 with only 700 people attending, but has exploded in the last few years to draw in over 36,000 people to Austin, TX.  This year, SxSW will be held March 11-20.

Thanks to Abby for sending it in, and it was also a very popular post on Mashable.

Wednesday
Feb162011

The Visual History of the Political Parties (infographic posters)


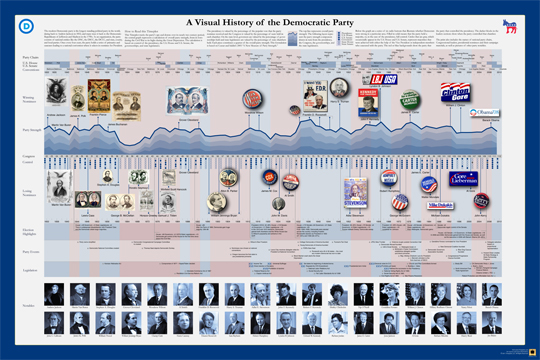
Timeplots.com has just released two new posters visualizing the history of the two major American political parties.  Zoomable images of both A Visual History of the Democratic Party and A Visual History of the Republican Party are available so you can see all of the detail online.  

Timeplots is also offering a discount to readers of Cool Infographics!  Enter the Coupon Code “CIG020311” to receive 10% off until 3/31/11!


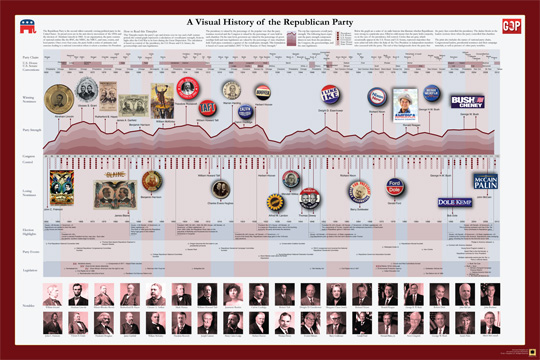
Just like the other great posters from Timeplots.com, these are highly-detailed posters, loaded with a huge amount of data.  At its heart, they are timelines that show the overall party strength from 1832 (Democrats) or 1856 (Republicans) to the present.  Along the timeline additional information is included like the names of the national party chairs, Congressional leaders, city where the party convention was held, who were the winning and losing party nominees for President (along with campaign material), election highlights, party events, major legislation, as well as pictures of other party notables.

You get the point that there is a lot of history in there!

It places each party event in historical context, visualizing a remarkable range of party events, legislation, election results, and leadership to succinctly tell the story of the party. Narratives are displayed within the larger context of party strength by aggregating and annotating data on presidential elections, Congress, Governorships and State Legislatures. The Timeplot provides a new lens into American political history; it is not intended to be absorbed at a glance, but rather to be visited and revisited over time.

Posters are 36” x 24” and normal price without the discount is $29.95.

Posters should start shipping by 2/28.  Also, check the Timeplots.com site for student discounts on any of their posters.

Friday
Feb112011

Hop On, Hop Off The Jefferson Airplane

Hop On, Hop Off The Jefferson Airplane is a visual history of the band Jefferson Airplane by Italian infographic artisan Gino Selva.  The colored lines show which performers were involved in each album and which instrument they played.  A guide on the left side shows which band name was used for the different albums.

It’s fairly complicated, but that’s the reality of the band’s history and why needs an infographic to help simplify it.

Nice job Gino!

Wednesday
Feb092011

The Doctor Who Infographic

Very cool overview Infographic History of Doctor Who, with some fantastic illustrations, by Bob Canada (@bob_canada on Twitter).  The world of Doctor Who is incredibly complex, but this infographic gives new viewers the basics.


Here’s everything you’ve ever wanted to know about the Doctor, but were afraid to ask. Click here to see a super-sized version so you can better read the text.

This piece took quite a while to finish. I worked on it a little at a time over several days. There was a lot of moving around of elements and a lot of text editing to get everything to fit in an efficient manner. Hopefully there aren’t any glaring errors in the information.

Laid out entirely in InDesign. All the Doctors, the Sonics and the TARDIS were drawn in InDesign as well.


You can tell from the illustrations that the hair was iconic for each Doctor.  You could probably identify each doctor in silhouette by the hair alone!

Monday
Jan102011

The (Visual) Evolution of the Batmobile


This is a really TALL infographic, but fun to read through nevertheless.  The Evolution of the Batmobile from Carinsurance.org (I wish they would credit the designer) is a visual timeline in the form of a comic book page looking at many (I’m sure they missed some, but not many) versions of the Batmobile from 1941 to 2010.  They also cover different versions from comics, television, movies, ads, posters and computer games.

The Batmobile has always been the trademark vehicle for Batman. However, throughout the history of the comic, the Batmobile has undergone some changes to its design and gadgets. Here’s an overview of some of the evolutions of the Batmobile.


Thursday
Jan062011

The 2010 Year in Review #infographic


OnlineSchools.org has released the 2010 Year in Review zoomable infographic summarizing the major events of 2010.  The zoomable version is below, and it’s best viewed in full-screen million.

I have mixed feelings about this one.  Using the outer space metaphor, there are 15 major news categories with text descriptions of a handful of events in each.  Each event has a small celestial body illustration related to it, and a measure of blog posts and tweets on Twitter related to the event.


It really does need the zoomable feature, because the font sizes are dramatically different between the titles and the text.  That does make it difficult to read sometimes.  I noticed the Star Trek font used as well as part of the sections.

In the corners are some visualizations of things like Top Memes, Top Songs, Twitter Trends, Yahoo Searches and Google’s Fastest Rising Searches.


I think this one is missing good sources for where their information came from, a designer listing, some of the text s too small and in some cases is more illustration then infographic.  Overall it’s fun to zoom around and appreciate the details they’ve included.

Thanks Brittany!