About
Randy Krum
President of InfoNewt.
Data Visualization and Infographic Design

Infographic Design

Infographics Design | Presentations
Consulting | Data Visualizations

DFW DataViz Meetup

Join the DFW Data Visualization and Infographics Meetup Group if you're in the Dallas/Fort Worth area!

Search the Cool Infographics site

Custom Search

Subscriptions:


Feedburner

The Cool Infographics® Gallery:

How to add the
Cool Infographics button to your:

Cool Infographics iOS icon

- iPhone
- iPad
- iPod Touch


Read on Flipboard for iPad and iPhone

Featured in the Tech & Science category

Flipboard icon

Twitter Feed
From the Bookstore

Caffeine Poster

The Caffeine Poster infographic

Entries in video (137)

Wednesday
Oct102012

The Noun Project

Building a Global Visual Language from The Noun Project on Vimeo.

The Noun Project is beauty in its simplicity.

I post this video for two reasons:

  1. Even though there are no statistics in the video, I do consider this to be an infographic video.  The video is a visual explanation that “shows” the audience icons and illustrations that convey the meaning of representing human concepts in visual form.

  2. The Noun Project is a fantastic effort to design universal icons.  The idea is to design and gather illustrations of concepts that cross languages and cultures, and then make tham available to everyone under Creative Commons license to use in their own designs.  Obviously good for infographic design, but also for presentations, websites and even school reports.

From the Noun Project About Page:

Creating, Sharing and Celebrating the World’s Visual Language

The Noun Project is a platform empowering the community to build a global visual language that everyone can understand.

Visual communication is incredibly powerful. Symbols have the ability to transcend cultural and language barriers and deliver concise information effortlessly and instantaneously. For the first time, this image-based system of communication is being combined with technology to create a social language that unites the world.

Anyone can also register and submit their own designs to be considered for inclusion in the library.

Like designed by Marwa Boukarim from The Noun Project


Tuesday
Aug142012

The Lifespan of Storage Media

Crashplan has just released The Lifespan of Storage Media, a comprehensive guide to how long your data will last.  Designed by Mike Wirth with InfoNewt, this infographic compares the expected lifespans of popular media types used over the last 100 years to save different kinds of information: computer data, photos, videos and audio.  Do your 8-tracks still play?

As each new form of data storage comes on the scene, the market is at first enamored with its compactness, convenience and hoped-for data longevity. But invariably, the reality of physical vulnerability and a limited lifespan remains. Eventually, all media fails, but Cloud backup is forever.

This was a fantastic project to work on, and the data research was the most challenging piece.  We had to find data to support both an average expected life and an extended “with extreme care” life.  We certainly found some contradictory data sources, and ultimately used data we felt was the most commonly accepted in the industry.

Do you have old computer backups burned to CDs, tapes or even hard drives on your shelf?  Don’t count on being able to read the data from them too much longer!  The short lifespan for many of these types of media that people use everyday to archive their personal photos and videos was most surprising.

Thanks to the team at Crashplan for a great project!

Friday
Jul062012

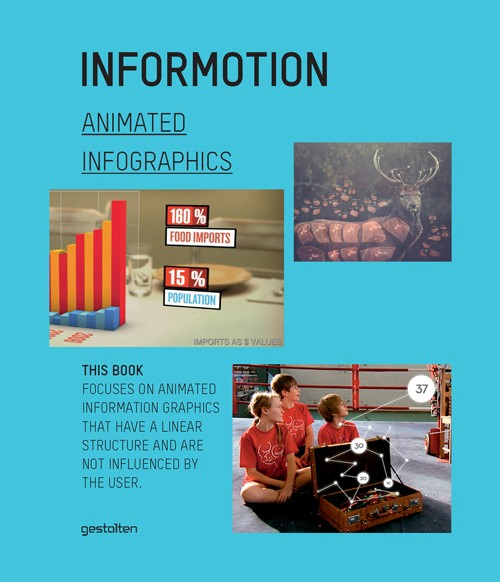
Informotion: Animated Infographics - Interview & Book Giveaway

Informotion: Animated Infographicsfrom Informotion: Animated Graphics, Copyright Gestalten 2012

The Informotion: Animated Infographics book edited by Tim Finke, Sebastian Manger and Stefan Fichtel was just released from Gestalten, and only recently appeared in the U.S.  I also have a promotional copy of the book to giveaway!  So keep reading until the end to find out how to get a chance to win the book.
Informotion: Animated Infographicsfrom Informotion: Animated Graphics, Copyright Gestalten 2012

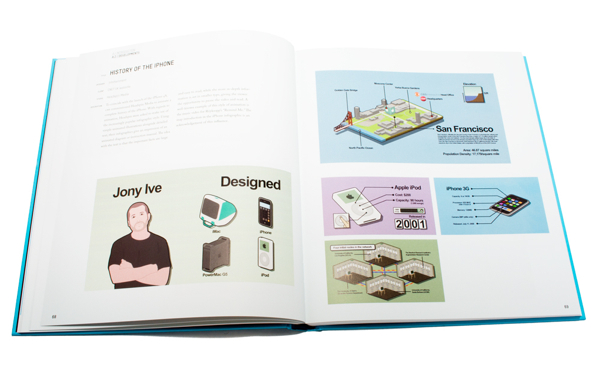
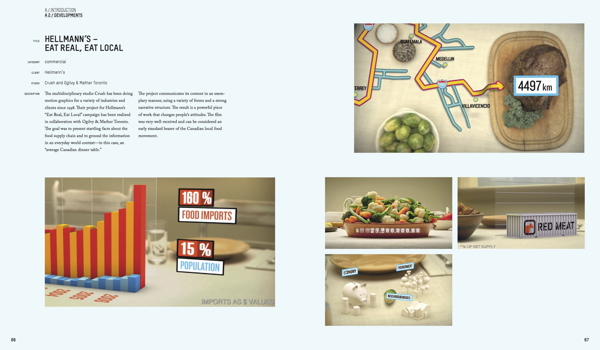
This is the only book I am aware of that focuses on infographic animation and video production.  The book covers topics like Forms of Representation, Storyboarding, Animation, Voice-Over Narration and Content.  The book also highlights at least 25 animated infographic videos, and takes a deep look at how they were made.

At the nexus of design and journalism, the field of information graphics offers some of the most exciting and dynamic work for creatives. Today, even more so than static versions, animated information graphics are serving to communicate complex correlations succinctly. The production of such animations on the basis of up-to-the-minute data is already common practice in select TV programs. Now, these moving formats are finding wider application in television and on the internet, as well as on an increasing number of mobile devices, and in public places. They can be seen in editorial contexts and in the areas of advertising and corporate communication.

Informotion is the first book to document the fundamentals needed to create compelling animated infographics and to explain them with numerous examples. It focuses on key aspects of visualizing data, current forms of information graphics, and future possibilities for moving images. The publication also outlines the factors that improve the viewer’s ability to absorb information.

Informotion: Animated Infographicsfrom Informotion: Animated Graphics, Copyright Gestalten 2012


Sebastian Manger was kind enough to provide some of his time to answer a series of interview questions about the future of infographic videos and production of the book:

CI: What brought you, Tim Finke, and Stefan Fichtel together to collaborate on the book?

Sebastian

 Manger: Tim and I both studied communication design at the University of Applied Sciences in Potsdam near Berlin. Our collaboration on many projects during our studies welded us together as team, and so we decided to do our master’s thesis as a joint project as well. This thesis formed the initial basis for Informotion. During our research for the book we came into contact with Stefan Fichtel. We initially just wanted to interview him about his experiences in the field of information graphics, but we then wound up working with him more closely.

CI: You cover this briefly in the book, but how do you define the difference between data visualizations and infographics?

Sebastian

 Manger: Data visualization is mostly based on a very complex set of data, which is then transmitted by tools such as processing into a graphical representation. Examples can include user behavior in a certain context or the air traffic in a given airspace. In our opinion, an infographic is more concentrated on a particular piece of information that needs to be communicated. In contrast to data visualization, infographics often boil something down to one core message that is then conveyed.

CI: Who do you see as the primary audience for the book?

Sebastian Manger: The book is a guide for designing animated infographics. Therefore, the primary target group is, of course, designers who create those. But Informotion is actually also interesting for any designer who deals with the transfer of information through moving images because it deals with our general perception of animation. The book introduces the range of tools now available for implementing animated infographics and explains their appropriate use. 

In addition, Informotion is also very interesting for journalists. They can gain valuable insight into how the information they first researched can be processed into an animation. This insight can then help avoid misunderstandings in any future collaboration.

CI: How difficult was it to select the videos in the book and did you get support from the companies that produced the videos?

Sebastian Manger: In some cases, the choice was indeed very difficult—especially when we needed examples focusing on a particular means of implementation. In those cases, we needed scenes that showed exactly what was meant without getting overlayed by other effects or information. In our thesis, which was the original inspiration for the book, we simply created such specific examples ourselves. For Informotion, however, we wanted to always use current examples from actual practice.

Once we found a fitting example, it was usually quite easy to convince the agency or studio to participate in the book. It was, however, sometimes a bit difficult to figure out who exactly was the author of a certain animation.

CI: Based on what you have observed, is there a “best practice” method for releasing an infographic video on the Internet?

Sebastian Manger: As the field of animated infographics is still quite young, it is currently very difficult to speak of a “best practice” example. We do hope that our book can help generate such an example one day.

CI: Do you believe that infographic videos are a stronger tool than static image or interactive infographics? 

Sebastian Manger: Yes, we do. People’s viewing habits are changing more and more. Ever more videos are appearing on the internet (YouTube, Vimeo, etc). The viewer is already getting used to absorbing information more passively. This environment is very favorable for the use of animated infographics. A certain fact can be presented to viewers in a simple manner without the need for them to toil through charts or diagrams themselves.

But herein also lies a danger or a special responsibility for the designer of an animated infographic. Under these conditions, a given set of information must always be reduced to a few details. In a static infographic, a statistic for example, viewers can make conclusions by themselves—provided, of course, that they take the time to do so.

CI: How quickly are infographic videos growing as a communication tool?

Sebastian Manger: In our research over the last few years we have ascertained a clear increase in the use of animated infographics. A simple indicator of this, for example, is the increasing number of videos tagged as “animated infographics” on YouTube or Vimeo. The number of websites and blogs that feature animated infographics is also growing continuously.

In addition, infographic design elements are being used more and more frequently in music videos, commercials, main titles, etc. This paves the way for consumers to deal with infographics as a means of implementation. Of course, the use of graphic elements in these fields is currently mostly limited to decoration, but why can’t it expand over the next few years and become more professional? These circumstances are causing viewing habits to change. Designers not only have a significant interest in these changes, but are also a contributing factor to them.

CI: What do you see as the future of infographic videos?

Sebastian Manger: We expect that the trend just described in our previous answer will continue and that animated infographics will be used even more frequently—especially in fields such as reporting but also in advertising. For most people, the use of information graphics is an indicator of seriousness. However, interactive graphics and data visualization will certainly play a huge role too.

CI: How difficult was it to put together a paper book about the highly visual topic of infographic videos?

Sebastian Manger: Not very difficult. Informotion includes a login code for accessing a password-protected website from where you can watch all the referenced videos in full length. In the printed book we use screenshots from and explanations of these videos to identify and explain current theories and means of implementation.

CI: Do you have any plans for a video infographic about video infographics in the future?

Sebastian

 Manger: Not until you came up with this question, but we’ll surely think about now!


Free Copy of the Book:

I have two copies of the book to give away to readers of Cool Infographics.  To enter you name into the hat, tweet a link to this blog post on Twitter and include the hashtag #informotionbook so I can find the Tweets.  At noon on Friday, July 13, 2012, I will randomly choose two people from the Tweets to receive a copy of the book.  You need to be following me (@rtkrum) on Twitter so I can send you a Direct Message (DM) if you are selected.

Here’s an example Tweet that would qualify:

Check out Informotion, the new book about animated infographic videos bit.ly/OdaGTg #informotionbook

Thanks to Sebastian for all his hard work, and participating with the interview.

Wednesday
Jun062012

Gymkhana: The Infographic

DC Shoes - Gymkhana Infographic

Gymkhana: The Infographic, is a design collaboration between InfoNewt (my company) and the design team at DC Shoes.  Gymkhana has become a mega-viral hit series of YouTube videos showing Ken Block and his rally car racing through different locations and performing many cool driving stunts.  There have been four Gymkhana videos released on YouTube in the last four years with over 135 million views combined, and Gymkhana 5 is expected this summer!

The DC Ken Block Gymkhana Project is a viral phenomenon with well over 135 Million views worldwide and a collection of more than 40+ videos. The Gymkhana franchise has won countless awards including top rated, most shared video series and most recently received the award for #1 viral video ad of 2011.

Created as a fun way to check out all things Gymkhana, the Infographic displays highlights, amazing stats and facts about the Gymkhana YouTube videos. “The fun just keeps on rolling along,” said Ken Block, the Gymkhana star and co-founder of DC Shoes. “The Gymkhana Infographic puts together some outstanding facts. Even I didn’t know that the Ford Fiesta used in Gymkhana 4 had 9 times the horsepower as my first car, a 1984 Toyota Corolla station wagon. Astounding!”

The infographic brings new viewers up to speed leading up to the release of Gymkhana 5, and gives fans of the videos a bunch of behind-the-scenes information they can’t find anywhere else.

Thanks to the team at DC Shoes for a great project!

Tuesday
May292012

Hans Rosling TEDTalk: Religions and Babies

Another great TEDTalk from Hans Rosling called Religions and Babies about the growth of the world population.

Hans Rosling had a question: Do some religions have a higher birth rate than others — and how does this affect global population growth? Speaking at the TEDxSummit in Doha, Qatar, he graphs data over time and across religions. With his trademark humor and sharp insight, Hans reaches a surprising conclusion on world fertility rates.

In Hans Rosling’s hands, data sings. Global trends in health and economics come to vivid life. And the big picture of global development—with some surprisingly good news—snaps into sharp focus.

Wielding the datavis tool Gapminder, Professor Rosling is a master at using data visualization to tell his story.

The video is also avilable on YouTube for portable devices:

Tuesday
May222012

A Marketer's Guide to Pinterest, Video and Infographic

The Marketer’s Guide to Pintrest infographic video from MDG Advertising illustrates this hot new trend with this video that builds on their static infographic Pin It To Win It!

MDG Advertising has produced an engaging video highlighting the facts, figures, and findings from its popular “Pin It To Win It” infographic.

The video details the social site’s demographics, growth, and potential to drive abundant traffic to company websites. Pinterest is especially popular with the most highly coveted markets—about 60 percent are female and 80 percent are in the 25 to 54 age demographic. Plus, Pinterest drives more referral traffic than Google+, LinkedIn, and YouTube combined.

The video goes on to cover the brands, both large and small, on board the pinboard phenomenon, such as Whole Foods, Etsy, West Elm, and Real Simple. These companies reflect the cooking, décor, and crafts interests that are prevalent among the Pinterest audience.

In addition, the video helps marketers navigate Pinterest’s features and terminology by demonstrating the “pin,” “repinning,” and “board.” It also shows how companies can leverage Pinterest for maximum response and referral traffic, whether by improving their image quality or promoting more than just a product line.

Only a couple companies have begun to leverage the research and time put into developing a static infographic, by using that same data to produce an infographic video that reaches a whole new audience.  It’s a very effective way to get the most out of the data research that was already done as part of designing the original infographic.

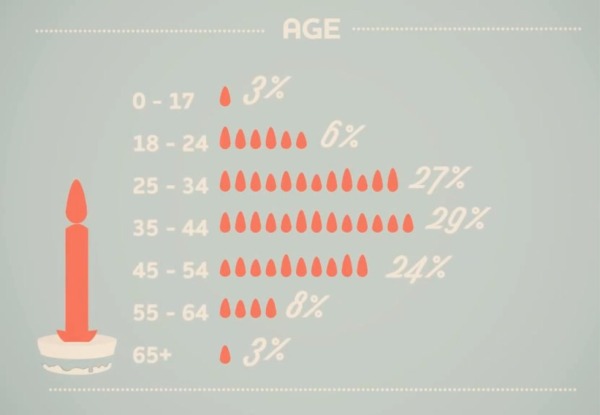
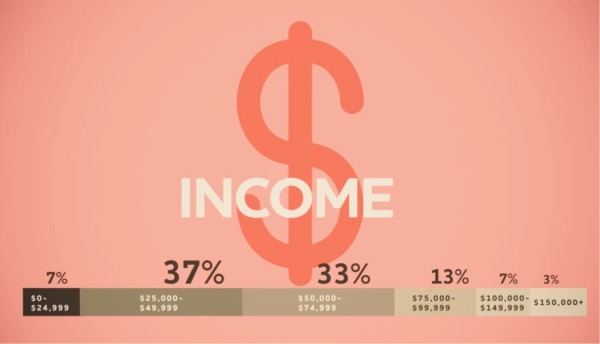
The most disappointing thing is that whoever did the video production got the data visualizations wrong.  Since when is 6 six times as big as 3?  And 27 only twice as big as 6?


3% and 7% sections of the stacked bar can’t be the same size.  In fact, 3% looks a little bit bigger to make room for the text.


Here’s the original static infographic, Pin It To Win It, where they got the data visualizations correct.  I’m guessing that the infographic designer was not involved in the video production.

Marketer's Guide to Pinterest infographic


Thanks to MDG Advertising for sending in the link!  Also found on Daily Infographic and The Infographic Showcase.

Wednesday
May092012

TEDTalk Video: Information is Food

In March 2012, JP Rangaswami gave a short TEDTalk in Austin, TX, Information Is Food, about treating information similar to how we treat food.

How do we consume data? At TED@SXSWi, technologist JP Rangaswami muses on our relationship to information, and offers a surprising and sharp insight: we treat it like food.

With a background in economics and journalism, JP Rangaswami has been a technology innovator and chief information officer for many leading financial firms. As an advocate for open source and disruptive technologies, Rangaswami has been a leading force in the success of multiple startups, including School of Everything, Salesforce.com and Ribbit. He blogs (unmissably) at Confused of Calcutta.

This is an interesting concept, and was appealing to me because I talk about humans evolving into Informavores in my presentations about infographics and data visualization.

The analogy is that we have food consumption issues that cause health problems, and we can have information overload issues that can cause issues with understanding and our belief systems.  I loved the quote from the presentation posing the question: “Are we going to reach the stage where information has a percentage of fact associated with it?”

The video is also available on YouTube:


Monday
Apr022012

Jer Thorp: Make data more human

Jer Thorp works in the New York Times labs to design big data visualizations, and his great presentation from TEDxVancouver was just posted.

Jer Thorp creates beautiful data visualizations to put abstract data into a human context. At TEDxVancouver, he shares his moving projects, from graphing an entire year’s news cycle, to mapping the way people share articles across the internet.

Jer Thorp’s work focuses on adding meaning and narrative to huge amounts of data as a way to help people take control of the information that surrounds them.

He’s been involved in some great big data projects that I have posted about here on the blog previously, like OpenPaths.

Monday
Apr022012

Interactive Infographic: Coca-Cola vs. Pepsi


The Coke VS. Pepsi: The Cola Wars infographic from cnntees.com. Which side are you on?

For over a century Coke and Pepsi have been at each other’s throats in a constant struggle for a bigger piece of the billion-dollar soda market. 

Along the way the companies have picked up a slew of loyalists and fans, adamant that their cola reigns supreme. While there are countless spots online to check out the history of either company we decided to put together an interactive infographic, putting all cola war highlights together in one spot.

This is a really fascinating experiment with infographic design.  Although it appears to be a static infographic, it’s actually interactive.  If you look closely, there are two videos built directly into the middle of the infographic that play when clicked.  The growth chart at the top is also interactive.  Click on a decade, and then choose the specific year, and it displays events in each companies history related to that time period.

The interactivity is so subtle though, most people will probably miss it without me spelling it out in the title and here in the commentary.

The financial stats section is a really poor use of pie charts in the bottle caps.  The logo images work, but pie charts are for visualizing percentages.  Here, they forced the data into the cute visual, but it makes the data confusing and hard to understand.    Are the charts visualizing the percentages of each expense related to total revenue, or just arbitrarily visualizing the values to represent the comparison between the two companies?  No percentages are shown, and no values are shown for the values of the total pie.  This is forcing a round peg into a square hole.

At the bottom, it’s missing a URL to the original blog post (so readers that find this on the Internet can find the original high-resolution infographic), a copyright statement, a trademark statement and a credit to the designer.

Thanks to Ron for sending in the link!

Tuesday
Nov082011

How Did We Get to 7 Billion People So Fast?

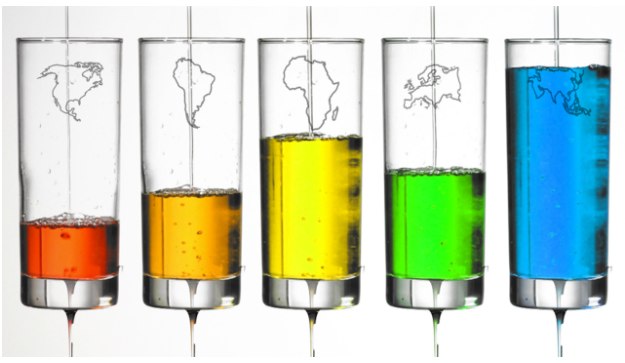
I love the cool infographic video from NPR.  7 Billion: How Did We Get So Big So Fast? is a video that uses colored liquids to visualize the population rates of the differen continents.  High birth rates mean fast liquid pouring in, slower death rates slow down the liquid dripping out of the bottom.

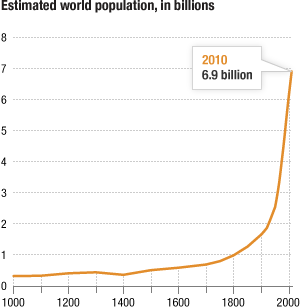
The U.N. estimates that the world’s population will pass the 7 billion mark on Monday. [Oct 31st]

As NPR’s Adam Cole reports, it was just over two centuries ago that the global population was 1 billion — in 1804. But better medicine and improved agriculture resulted in higher life expectancy for children, dramatically increasing the world population.

Found on FlowingData