About
Randy Krum
President of InfoNewt.
Data Visualization and Infographic Design

Infographic Design

Infographics Design | Presentations
Consulting | Data Visualizations

DFW DataViz Meetup

Join the DFW Data Visualization and Infographics Meetup Group if you're in the Dallas/Fort Worth area!

Search the Cool Infographics site

Custom Search

Subscriptions:


Feedburner

The Cool Infographics® Gallery:

How to add the
Cool Infographics button to your:

Cool Infographics iOS icon

- iPhone
- iPad
- iPod Touch


Read on Flipboard for iPad and iPhone

Featured in the Tech & Science category

Flipboard icon

Twitter Feed
From the Bookstore

Caffeine Poster

The Caffeine Poster infographic

Entries in video (137)

Monday
Oct122015

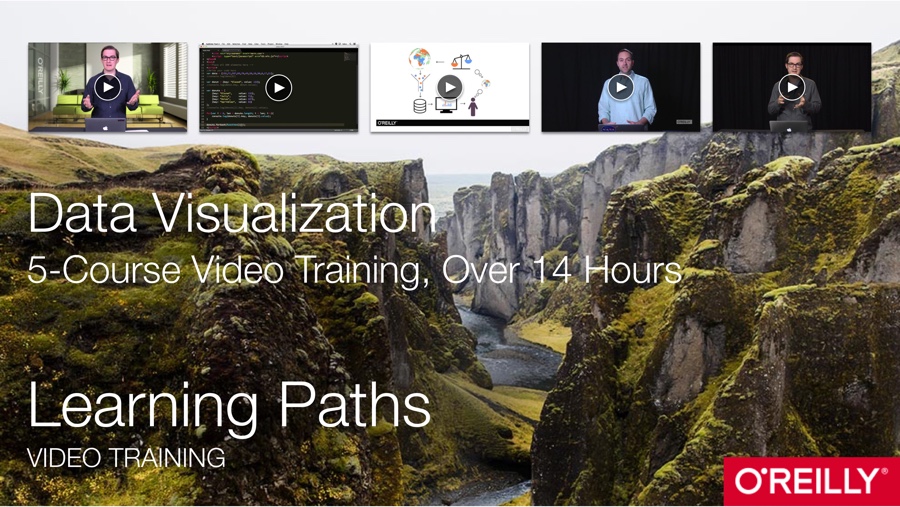
Giveaway: Data Visualization Training Video Package

I have ONE Data Visualization - 5-Course Video Training package from O'Reilly to give away in October! This is a great giveaway! Regular price $309.99, Over 14 Hours of online training

Register HERE by 11:59pm on October 30, 2015 to be entered.

A winner will be randomly selected on Oct 31st.

Successful data visualizations allow you to impart meaning and emphasis to your data points. This Learning Path will teach you how to display trends, patterns, and outliers while you discover the power of letting your data to speak. Once you’ve finished, you’ll be able to efficiently communicate volumes of data with ease. The Data Visualization training package includes all five course videos:

  1. An Introduction to d3.js: From Scattered to Scatterplot, Presented by Scott Murray | 2 hours 52 minutes
  2. Learning to Visualize Data with D3.js, Presented by Rafael Hernandez | 3 hours 52 minutes
  3. Using Storytelling to Effectively Communicate Data, Presented by Michael Freeman | 1 hour 30 minutes
  4. Effective Data Visualization, Presented by Jeff Heer | 2 hours 52 minutes
  5. Intermediate D3.js, Presented by Scott Murray | 3 hours 38 minutes
Friday
Aug212015

Visual Storytelling: The Big Trend for SXSW 2016

It’s only August, but voting is already underway for the March 2016 South By Southwest (SxSW) Interactive conference. Long thought of as the breeding ground for new ideas and creative technologies, we can gleam industry insights from the SXSW Interactive Festival. This year, I decided not to wait until the conference to delve into the veritable buffet of groundbreaking panels vying for festival space. This year’s PanelPicker interface received more than 4,000 proposals, which is an all-time record!

While a quick search of infographics yields only 11 results, a mere TWO actually have the word “Infographics” in the title. The industry discourse has shifted away from “how-to” models to “how to do it right.” Infographics have become a key format of the larger conversation: Visual Storytelling.

A quick search for “Visual Storytelling” yields over 200 talks in PanelPicker, along with hundreds more for “data visualization” and “visual content”.  Infographics are now used as one of many effective tools in the Marketer’s toolbox, and an accepted part of the larger conversation happening in the content marketing industry.

Visual storytelling is vital to content marketing success. The following types of visual content are at the forefront of the proposals for next year’s SXSW Interactive Festival.

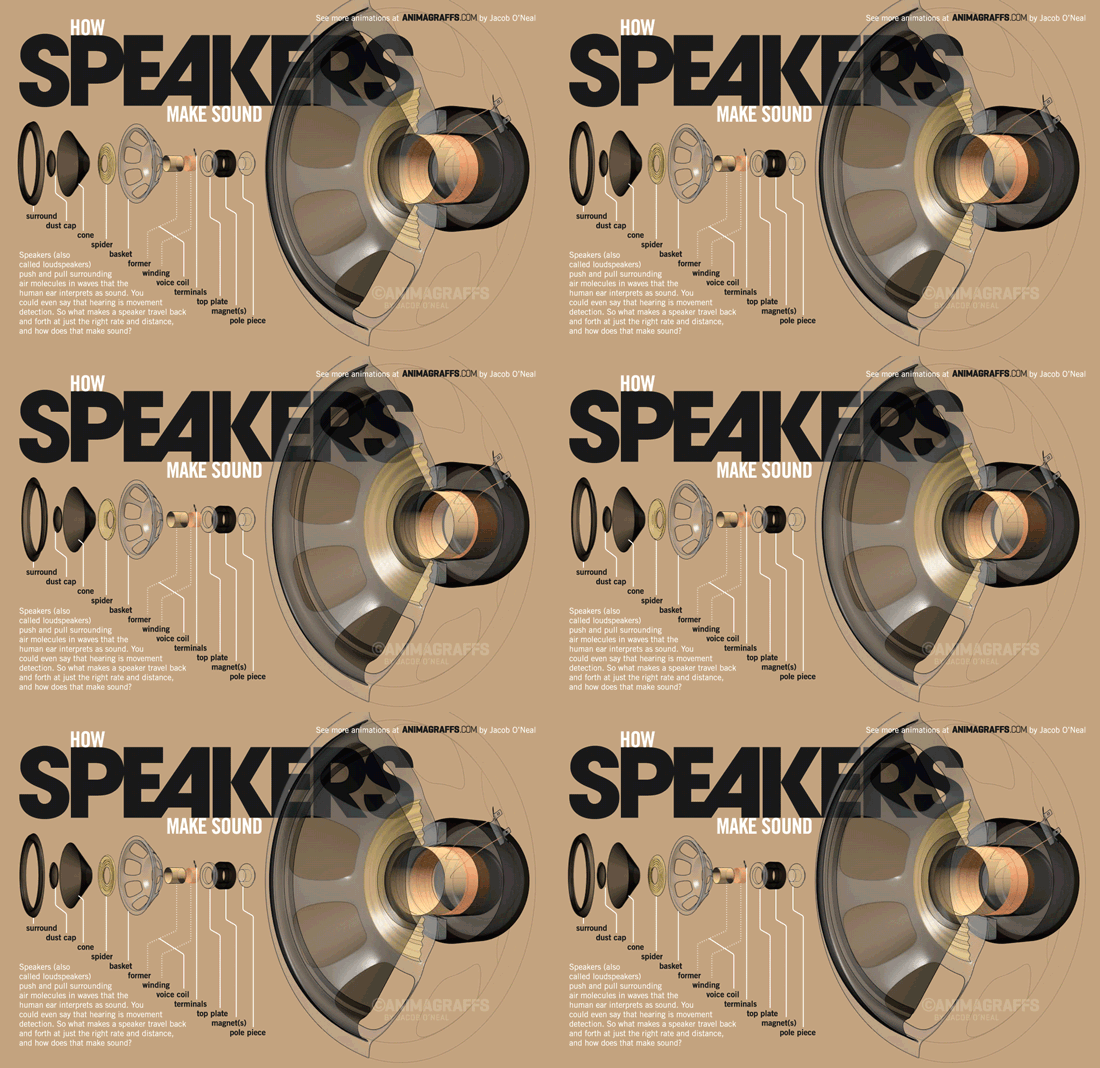
1.    Animated GIFs

Source: Animagraffs by Jacob O'Neal

The social media world has been slow to adopt GIFs, with Facebook only just embracing the truncated clips this year. The average human attention span in 2015 is 8.25 seconds, so these bite-sized animations are the perfect for telling a complete story in a short amount of time. The motion in the image also captures attention on an already crowded news feed.

Check out these GIF-centric presentations, “Why GIFs are turning into the New Emojis on Mobile” and “Visual Storytelling - GIFs, Graphs, and Napoleon.


2.    Visual Presentations

Slideshare and other presentation-style platforms provide a visual and interactive way to share lots of information. With millions of visitors per month, Slideshare is an easy way to have your presentations seen by a large audience.

Perfect your visual presentations with “Sucking Less When Presenting Creative” and “The Power of Poise: Chi for Pitch and Presentation.”     


3.     Real-time storytelling

Real-time storytelling has increased in popularity with the rise of live feed social platforms like Periscope and Meerkat. The ease of execution and the sheer scope of the audience made these two platforms instantly successful. While Meerkat took the prize for most buzzed app at last year’s SXSW, Periscope has the weight of Twitter behind it and has become the more successful of the two.

Use these two tools to live broadcast your events, host a Q&A, or even share professional tips to a larger audience. Perfect your live-streaming with the “Live Streaming Killed Cable TV Star” and “Igniting Creativity with Periscope” PanelPicker proposals.

Twitter Periscope

Source: AdWeek


4.    Infographics

I couldn’t get through my list without mentioning infographics. Still one of the best ways to convey complex information in a shareable and visually appealing format, infographics should be worked into your content marketing strategy. While they are no longer the only way to tell a visual story, they remain a marketing industry staple.

Round out your visual storytelling prowess with great infographics. Learn how to rock your next infographic with my own proposal, “7 Deadly Sins of Infographics Design and How to Fix Them.

The Process of Designing an Infographic


Source: Visme 

Buzzword or not, visual storytelling is something we’ve all been doing since we first snapped a picture with a polaroid camera, we’re just getting better at it. Judging by PanelPicker entries alone, the 2016 SXSW Interactive Festival will be another great year for the content marketing industry.

Monday
Jun152015

Infographics Are Evolving into Many Formats

The internet is full of noise, and your job is to break through that wall of information with something that resonates with your target audience. When you are communicating any message, you want to ensure that your audience will understand and remember the valuable takeaways about your products or services. You want your communication to be clear and concise. This is where infographics come in.

Infographics are your opportunity to convey complex ideas and information in a simple and easily digestible manner. Simply put, our brains love visual information. Infographics can make your marketing and advertising stand out in the crowded world of visual content.

As the Internet, our computing devices and out screen sizes continue to evolve and change, infographics need to evolve as well. Moving past the original static images, infographic storytelling with data visualizations and illustrations can now be found in a number of different formats.

Below, are great examples of different ways to leverage the five different types of infographics to make your product or services more memorable.


1. Static Infographics - Kitchen Conversion Guide

Static infographics are the most simple and most common infographic format out there. They are usually saved as an image file to be easily distributed and consumed (JPG or PNG format). Static infographics are easily shared using email and social media since there are no moving parts to consider.
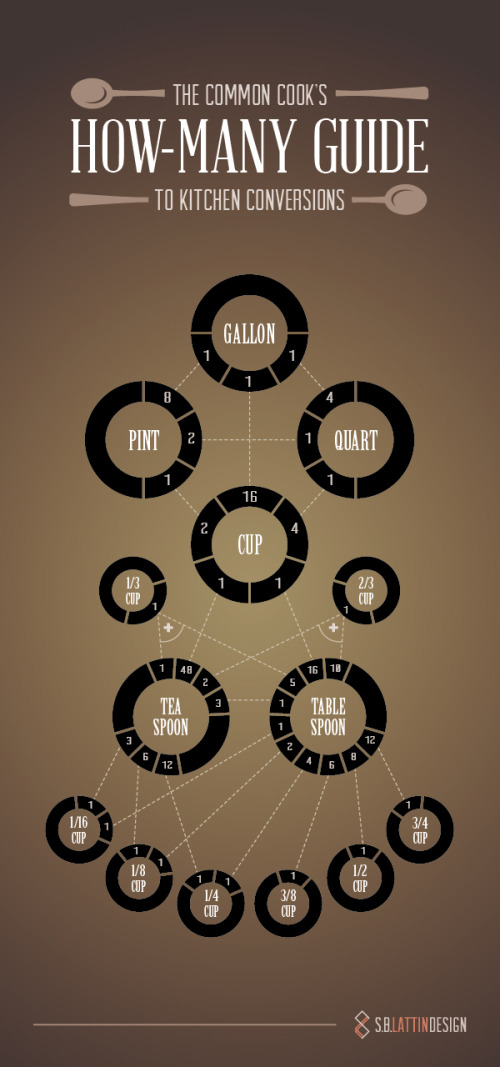
The Common Cook’s How-Many Guide to Kitchen Conversations

Source: https://shannon-lattin.squarespace.com/how-many-guide/

This type of infographic is also easily split up into segments in order to focus on one piece at a time. This is ideal for giving presentations or sharing on social media.


2. Interactive Infographics - Daily Dose of Water

Interactive infographics are great to utilize when you want people to move beyond simply looking at the information. Ideally your audience should get intimate with the facts you’re presenting by following a specific storyline told through your data. By giving your audience something to interact with, they are engaging more of their attention with the data, and will become more immersed in the information.

For example, this infographic from Good.is and Levi’s walks users through their typical routine and calculates how much water is used for each task. This allows a personalized experience for each person that views the infographic, creating a stronger connection to the information being shared.
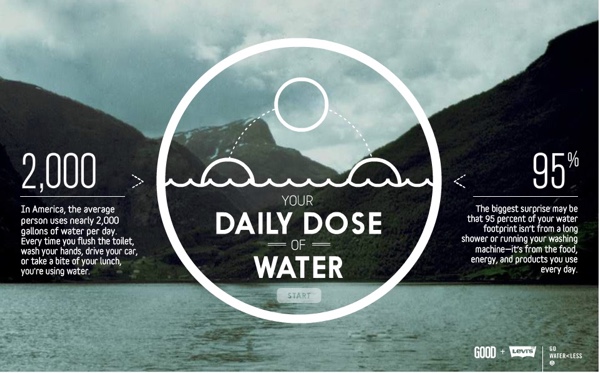
Your Daily Dose of Water

Source: http://awesome.good.is/transparency/web/1204/your-daily-dose-of-water/flash.html


3. Video Infographics - The Fallen of WWII

Video infographics have been gaining popularity over the years in part for a lot of the same reasons static infographics work: the ease of sharing and the ability to embed it almost anywhere.

In this video infographic that has recently gone viral, the creator uses data visualization to make a powerful statement about the sacrifice soldiers made during World War II. Data visualization is used in such a way to show the stark juxtaposition between the Second World War and more modern conflicts.  Check out this quick motion graphic titled, The Fallen of World War II from Austin-based developer Neil Halloran. His use of sound and motion brings the information to life.

The Fallen of World War II from Neil Halloran on Vimeo.


4. Zooming Infographics - The History of Film

Some infographic topics tackle a large amount of information, and a larger design is required to display all of its information. This infographic from Historyshots is a great example of a zooming infographic:
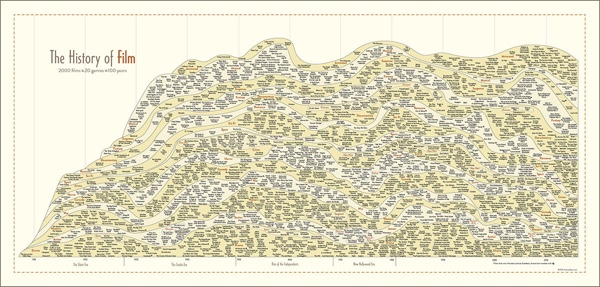
The History of Film

Source: http://www.historyshots.com/products/history-of-film

The History of Film plots out the most important films of the last 100 years into a beautiful, flowing timeline that visually separates the films into 20 different genres. As can be seen above, if this infographic was just left as a static image, it would be difficult to read everything because it is so detailed and complex. In the web browser, a large design is reduced in size so that the entire design can be viewed all at once on the screen, and the zooming controls are made available to the reader to view the small details clearly.


5. Animated Infographics - Flight Videos Deconstructed

Some topics for infographics are best created to feature motion, none more so than one that shows the the flight patterns of an Egyptian Fruit Bat, Dragonfly, Canada Goose, Hawk Moth, and Hummingbird. Flight Videos Deconstructed is an animated infographic about flight patterns within the animal kingdom. Covering five winged animals the and the motion their wings use while taking flight, this animated graphic uses vibrant colors and geometric shapes to convey the beauty and simplicity of flight.

Animated infographics create some motion or change in the design as the reader watches. It might be the bars in a bar chart growing, a color change, or (in the case of these winged animals) an animated character. These are differentiated from the video infographics because these are not video files. These are animated with HTML code or an animated GIF image file format to create the animation but can exist as a stand-alone object on a web page.
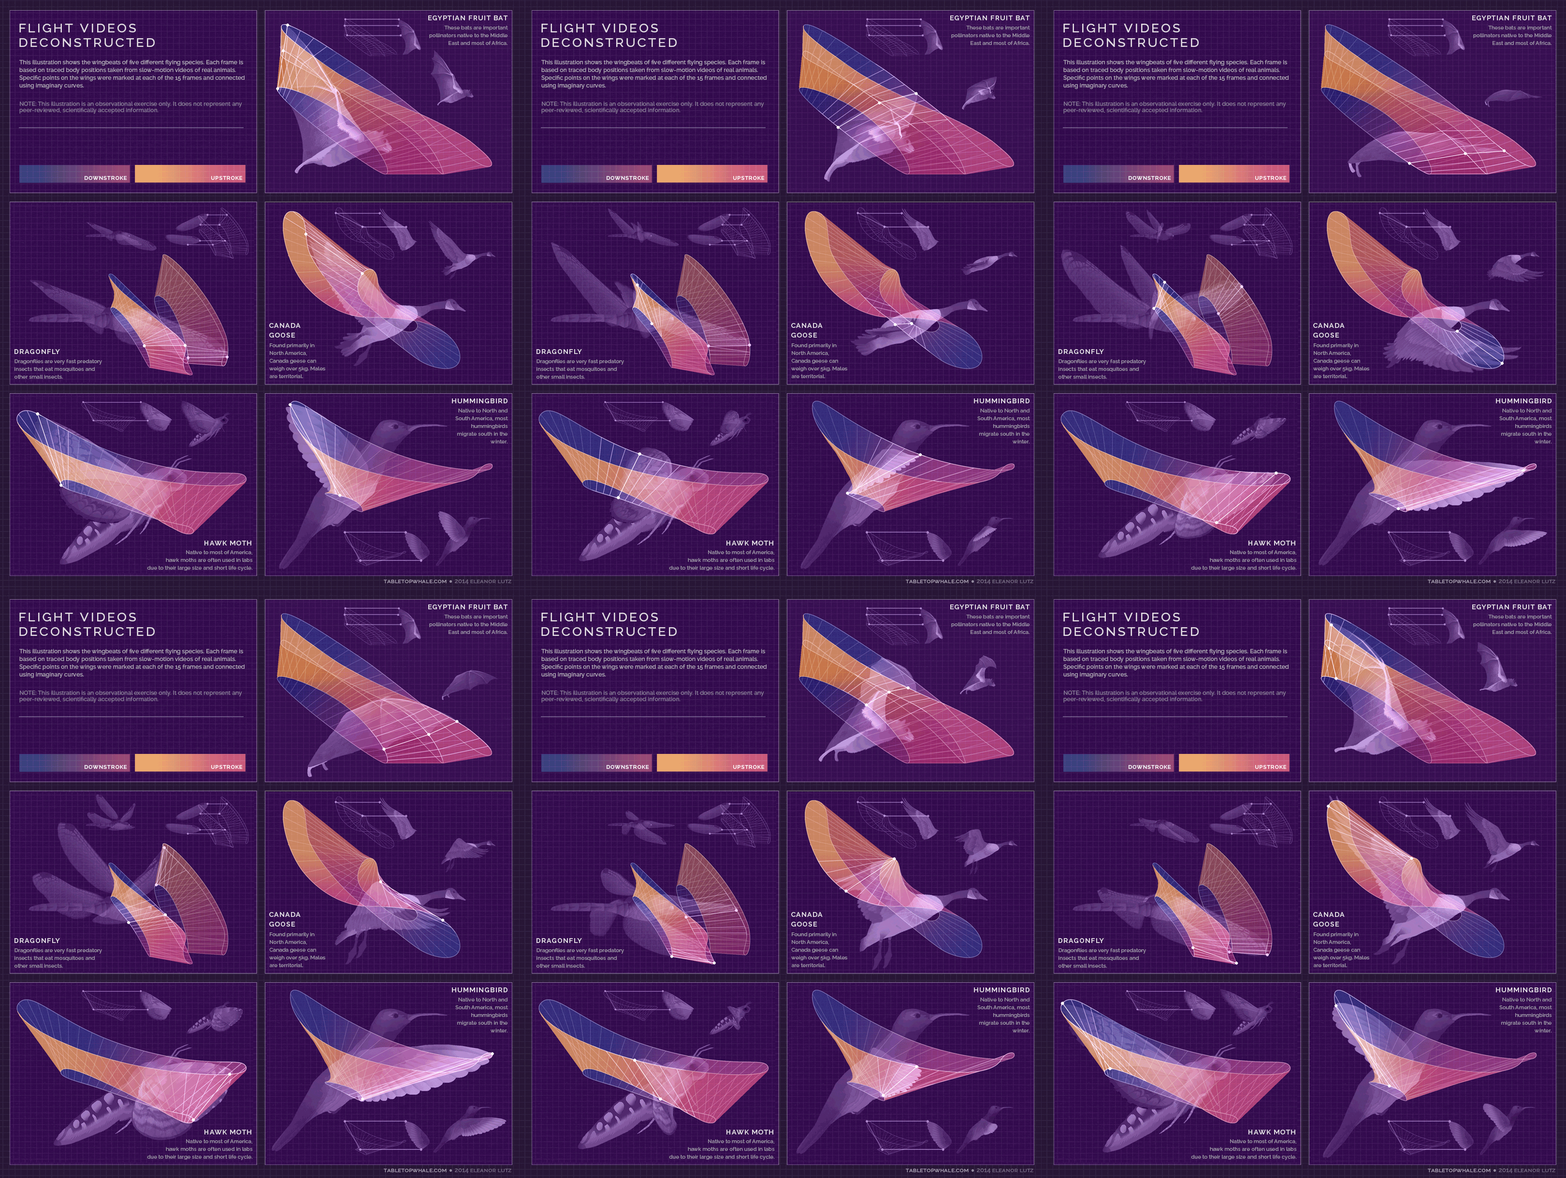
 

Flight Videos Deconstructed

Source: http://tabletopwhale.com/2014/09/29/flight-videos-deconstructed.html


With so many new and different formats of infographics available to today’s marketers, providing your audience with a story that conveys your message has never been more exciting. Sharing the key takeaways from your product or services can be done in an expertly designed way that appeals to your audience and leaves them wanting more. 

Thursday
Jun112015

UK Tax Burden Infographic Video

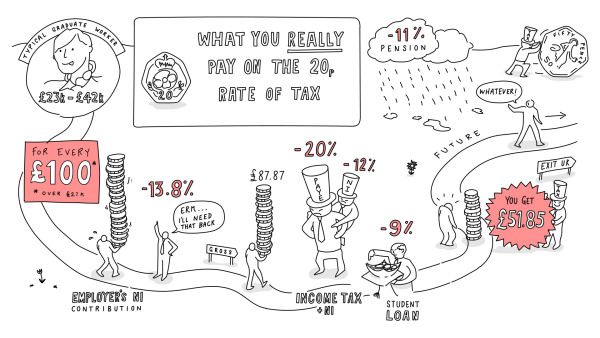
The UK Tax video, posted on Youtube by See What You Mean, explains how much money you actually receive after taxes in the UK. Below is the final infographic.

UK Tax Burden Infographic Video

The tax and deductions on your job are much higher than you might think. The Government likes to talk about a ‘20p rate’ – as if that’s all you pay. But actually, for a typical middle income graduate, total deductions are more than 48p in every pound earned (over the £21k threshold). And will rise to nearly 60p when the statutory pension scheme comes in by 2018.

What will it do for the incentive to work and do better, and to the UK’s general prosperity, when graduates only get 40% of any extra they earn?
Against this backdrop some politicians still talk of increasing the taxes on these middle earners.

This is a great example of using the hand-drawn style of design for infographics. Often used for graphic recording of events and meetings, the hand-drawn style has the look of someone just drawing on a whiteboard.

Video infographics tells stories in a very linear way, and in this case the visual metaphor of a road builds on that linear storyline even more. The drawing continues to build and reveal more information as the video progresses, and the viewer can see the overall design coming together.

I say this often, but I'll say it again. "Big numbers are not data visualizations." Visualizations can help the audience by showing the taxes percentages as taking their portion of a person's total salary. Just showing the text number of the percentages, doesn't help the viewers understand how large that tax burden is to them.

Thanks to Richard for sending in the link!

Wednesday
May272015

The Fallen of World War II

The Fallen of World War II from Neil Halloran on Vimeo.

The Fallen of World War II is an animated infographic video by Neil Halloran showing the scale of deaths in the U.S. and other countries involved in the war. He also has an experiemental interactive version at fallen.io

An animated data-driven documentary about war and peace, The Fallen of World War II looks at the human cost of the second world war and sizes up the numbers to other wars in history, including trends in recent conflicts.

Visit fallen.io for more information.

Love this! Very well done animated infographic video.

The stacks of icons shown for each country are 20 across, which is hard for most people to comprehend. We live in a Base-10 society, and showing the icons in rows of 10 would be much easier for audiences to understand.

There are a couple discrepancies as well. For example, the narration mentions that France lost 92,000 in the Battle of France, but the visualization only shows 86,000.

Also available on YouTube:

Wednesday
May132015

The Slow Speed of Light

Riding Light from Alphonse Swinehart on Vimeo.


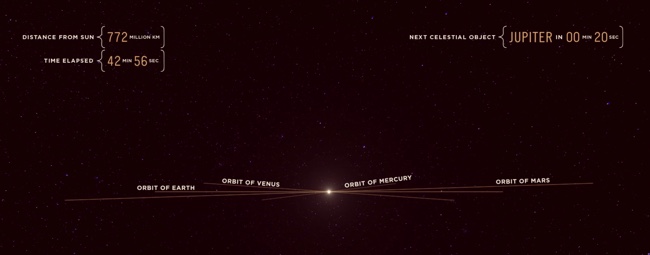
We think of the speed of light as incredibly fast, but in the video Riding Light, by Alphonse Swinehart, we ride along with light as it starts in our Sun and moves out past Jupiter in our solar system. The video is 45 minutes long and helps show both how large our solar system is, and that it still takes light a long time to travel these large distances.

In our terrestrial view of things, the speed of light seems incredibly fast. But as soon as you view it against the vast distances of the universe, it's unfortunately very slow. This animation illustrates, in realtime, the journey of a photon of light emitted from the surface of the sun and traveling across a portion of the solar system, from a human perspective.

I've taken liberties with certain things like the alignment of planets and asteroids, as well as ignoring the laws of relativity concerning what a photon actually "sees" or how time is experienced at the speed of light, but overall I've kept the size and distances of all the objects as accurate as possible. I also decided to end the animation just past Jupiter as I wanted to keep the running length below an hour.

During the course of the video, I also love the data visualziations shown during the flight, like how large the orbits of different planets appear to us as we move outward.

Also available on YouTube:

Friday
May092014

Comics That Ask "What If?"

Randall Monroe, author of my favorite web comic XKCD, gave a great TEDTalk about answering science and math questions with his comics.  One of the best parts of this video, and the web comic series in general, is that he uses hand-drawn data visualizations and illustrations to answer them, which makes them easier to understand.

Web cartoonist Randall Munroe answers simple what-if questions (“what if you hit a baseball moving at the speed of light?”) using math, physics, logic and deadpan humor. In this charming talk, a reader’s question about Google’s data warehouse leads Munroe down a circuitous path to a hilariously over-detailed answer — in which, shhh, you might actually learn something.

Pre-order or watch for his new book, “What If?” to be released in September 2014!

Monday
Apr212014

Choosing a Social Media Platform

Choosing a Social Media Platform infographic

Released about a year ago, the Choosing The Most Effective Social Media Platforms infographic was published by Edge Media and designed by Infographics.SG.  Photos, video, articles or text?  Depending on the type of content you are generating, your choices for effective social platforms are different.

Facebook, Twitter, Pinterest, Google+, LinkedIn. Etc. So many social media platforms. And so little time. (And manpower. And ideas.) 

There are costs involved to maintaining a social presence. It is vital for brands / companies / organisations to market on the right platform(s) in order to optimize their resource allocation. 

Use this infographic to help you choose the most efficient social media platform(s) according to factors like your goals, target audience and capabilities.

 The design includes a good mix of data visualization methods and the bold colors are eye catching to the audience.  However, some of the charts are difficult to understand.  The polar grid used for the “What Do You Aim To Achieve?” section does not clearly communicate the information to the readers.  I also the the colors should have been color-coded to be relevant to the specific social media brand colors. 

They also leveraged the infographic content into a SlideShare presetnation.  This allows them to utilize the content they already created on another social platform to reach a different audience.


Thanks to Brian for posting on Google+

Monday
Nov252013

How NOT To Look Ugly on a Webcam

How NOT To Look Ugly on a Webcam infographic

How NOT To Look Ugly on a Webcam from Mixergy and Lemon.ly lays out the top 10 tips for successfully using your webcam.

No matter who you are and how good you look, it’s pretty easy to look terrible on a webcam. We teamed up with our friends at Mixergy to showcase just how NOT to look bad on a webcam with this handy infographic. By just following a few of our easy webcam tips, you’ll look as good as you feel in your next webcam interview. What do you think? Have any other tricks to add?

Nice instructional how-to infographic.  There’s no data visualized, just illustrations of the 10 tips.  Quick and easy to read.  This design also has a long Online Lifespan.  The topic is so universal, the infographic will be relevant for years!

The footer should include the text URL link to the infographic landing page on either Mixergy or Lemon.ly so when readers see smaller thumbnail versions posted on Facebook, Pinterest, Twitter, Google+ or blogs without a link, they can still find the original full-size version!

Thanks to @jasongaloob on Twitter for the link!


And Guy Kawasaki on Facebook:

Tuesday
Oct292013

How Many Jelly Beans Do You Have Left?

The Time You Have (in Jelly Beans) is a great visualization in video of how many days are available to each of us during our lives.  Created by Ze Frank from Buzzfeed.com.  What will you do with the jelly beans you have left?

Found on Elite Daily.  Thanks to Mary Kaye for the link!