About
Randy Krum
President of InfoNewt.
Data Visualization and Infographic Design

Infographic Design

Infographics Design | Presentations
Consulting | Data Visualizations

DFW DataViz Meetup

Join the DFW Data Visualization and Infographics Meetup Group if you're in the Dallas/Fort Worth area!

Search the Cool Infographics site

Custom Search

Subscriptions:


Feedburner

The Cool Infographics® Gallery:

How to add the
Cool Infographics button to your:

Cool Infographics iOS icon

- iPhone
- iPad
- iPod Touch


Read on Flipboard for iPad and iPhone

Featured in the Tech & Science category

Flipboard icon

Twitter Feed
From the Bookstore

Caffeine Poster

The Caffeine Poster infographic

Entries in visual (320)

Monday
Jun062011

DataVis Contest from Postgrad and David McCandless

Postgrad.com is sponsoring a data visualization contest using data gathered by David McCandless.  There’s a brand new iPad2 for the winner, and the top 3 will receive signed copies of ‘Information is Beautiful’ by David McCandless.


It Started With A Tweet…

Data journalist and information designer, David McCandless recently gathered data revealing surprisingly low numbers of black students accepted into Oxford and Cambridge.  However, despite being genuinely passionate about the data, David didn’t have time to visualise it himself.  So he posted the following message on Twitter…

We contacted David and offered to put up a prize as a competition for the best visualisation of this data. To our delight, David accepted our offer.

Like David, we feel strongly that this data should be made visible to many. And we’re challenging you to do it.

UPDATE:  Although the initial findings related to the number of black students, there’s a lot of information within the datasets about the ethnic heritage, and socioeconomic background of students attending different institutions.  You are free to pick out whatever story you wish and present it in a visual format.

Enter Now To Win…

It’s easy to enter the competition and you could win:

  • Recognition from our panel of industry experts in journalism, data visualisation and design
  • Your name and work promoted across the web
  • A proud and noteworthy addition to your portfolio, website or CV
  • A full post profiling you and your work, and the design process you followed
  • A signed copy of Information is Beautiful by David McCandless
  • A brand new iPad2

Expert Judges From The BBC, .net Magazine And More…

Assisting David in the judging, we are thrilled to have judges from the BBC, .net Magazine, Tableau Software, Visualising Data, and marketing agency 97th Floor.

The judges will consider a range of criteria including design, effective visualisation, and presentation of the story.

  • Andy Kirk, Founder, Visualising Data Ltd
  • Chris Bennett, President, 97th Floor
  • David McCandless, Author, Information is Beautiful
  • Elissa Fink, VP Marketing, Tableau Software
  • Katherine Mann, Director, Postgrad.com
  • Rob Bowen, Art Editor, .net Magazine
  • Russell Smith, Editorial Development, BBC News

It’s An Open Brief

The competition is based on the data collected by David, and other sources listed within the dataset.  However, you are free to mashup the data with any other source you wish, provided the sources are publicly available and cited in your entry to the competition. 

Your visualisation can be static, moving or interactive

You can include as little or as much text as you like

It can be as simple as a single chart or a full-blown infographic

You’ve A Good Chance of Winning…

People are often put off entering competitions assuming there will be hundreds of entrants. In reality, this is rarely the case. Simply entering really could put you in the running for a prize. 

There’s a brand new iPad2 for the winner. And the top 3 will receive signed copies of ‘Information is Beautiful’ by David McCandless.

Entries from amateurs and newbies are very much welcome. We’d love to see what you come up with.

Remember, it doesn’t have to be a masterpiece. A simple yet effective piece of visualisation could be just the ticket.

And all highly recommended pieces, will receive recognition by our expert panel alongside the winners when results are announced.

Remember The Important Stuff

The competition rules are posted here.

You can grab the data here (be sure to check out the other sources listed within it).

To enter the competition, simply email your visualisation as a jpeg attachment to mark.johnstone@postgradsolutions.com and include your Full Name and the best email address to reach you on. As an alternative to sending your entry as an attachment, you are welcome to post your entry on your own site, and simply send us the link. In fact, we’d love it if you did that.

If your entry is interactive or moving, you will have to publish it on a separate site (your own site is preferable but social sites like YouTube are perfectly acceptable). Just remember to send us the link.

The competition closes at 11pm GMT on Monday 20th June 2011.

Winners will be announced by Monday 4th July 2011.

The Datasets

You can find the data collected by David McCandless here.

You may also find the following resources useful:

Guardian DataBlog post on Oxbridge Elitism

UCAS Annual Datasets

And Remember, the Competition Closes at 11pm GMT on Monday 20th June 2011.


Wednesday
Jun012011

Artfully visualizing our humanity: Aaron Koblin's TEDTalk 

In March 2011, Aaron Koblin, Creative Director of Google’s Data Arts team, gave a good TEDTalk presentation, Artfully Visualizing our Humanity, looking at a number of his visualization projects, and how visualizing data is becoming our interface to large datasets.

Artist Aaron Koblin takes vast amounts of data — and at times vast numbers of people — and weaves them into stunning visualizations. From elegant lines tracing airline flights to landscapes of cell phone data, from a Johnny Cash video assembled from crowd-sourced drawings to the “Wilderness Downtown” video that customizes for the user, his works brilliantly explore how modern technology can make us more human.

Found on FlowingData.com and Infosthetics.com

The video is now also available on YouTube:

Thursday
May262011

The Definitive Daft Punk...Visualized!


Cameron Adams, aka “The Man in Blue”, created a live visualization of the audio mashup he created between 23 different songs from Daft Punk.  The Definitive Daft Punk Visualized combines a circular waveform of each of the songs concurrently being played with an audio map timeline at the bottom showing each song color-coded.

In order to explain the layering and interplay that goes into something like a Girl Talk album or The 139 Mix Tape I decided to take my own mashup of Daft Punk’s discography – Definitive Daft Punk – and reveal its entire structure: the cutting, layering, levels and equalisation of 23 different songs. By dividing up the sound data for each song and computing its appearance in realtime, the resulting visualisation gives you an understanding of the unique anatomy of this particular mashup.

The entire piece is composed from the latest HTML5 and CSS3 technology (canvas, audio, transforms & transitions) so you’ll need a newer browser to view it in. I recommend Chrome because it pulls off the best performance with my mangled code. All of the waveform and spectrum visualisation is performed in realtime, so your browser is rendering a music video on the fly!

Hopefully it gives you a new insight into the artform of the mashup, otherwise you can just stare at the pretty shapes.

Found on Twitter via @kmcostello

Tuesday
May102011

Sitting All Day is Killing You [infographic]

Sitting is Killing You
Via: Medical Billing And Coding

You might want to stand up for this…

From MedicalBillingandCoding.org comes a new infographic about the health risks of sitting all day: Sitting Is Killing You.  A fun look at how sitting down will shorten your life.

As we enter the second decade of the 21st century, there is one thing nearly all modern Americans have in common: we sit all the time. Though our great shift towards computer-based work has done great things for productivity, it has, unfortunately, done terrible things for our health. From increased risk of heart disease and obesity in the long term, to sharply hampered cholesterol maintenance in the short term, the negative health effects of sitting are starting to weigh heavily against the benefits. Even the medical field – the greatest advocates and reducing sitting time – is plagued by this new health issue. Though doctors and nurses get plenty of walking time, it usually falls to the secretaries, billers, and coders to do all the sitting. And, as we can see, something has to change.

I wish some of the data visualizations had been designed better, but the overall infographic tells a story to the reader, and gets the point across well.  I would remove the data legends and axis labels, and put the data right into the charts.

Great design elements of non-rectangular sections and illustrations that break boundaries.  Long list of data sources, but there should be a designer credit. 

Found on Mashable.

Tuesday
Apr192011

Monster Trade Show Displays (infographic)


From Monster Displays, a trade show displays reseller, the Trade Show Displays infographic is a great example of how companies are beginning to use infographics more for business communcations.  Most of the infographics posted here on Cool Infographics are intended to be shared far and wide through social media, but you never see the infographics that companies use internally or as part of their sales presentations.

This may not be the best infographic design (there’s too much text for my tastes), but it is what I would call data-heavy.  The infographic “shows” the reader the different types of displays, where they are used in a trade show, standard sizes, configurations and even includes an explanation of the mathematical effect of advertising lag.  I think they felt they needed to over-explain each illustration with words, and they have some statistics that they didn’t visualize at all.

Trade shows and trade show displays have a science behind them that most casual visitors never see. This infographic begins to explain some of the basics that every trade show attendee and trade show presenter should be aware of. What are the types of trade show booths? What layouts are available for the presenter? What advantages does trade show marketing have over other advertising campaigns? Learn more about the decay effect and advertising lag and how trade show advertising is affected.

This would also make a nice poster, or a handout to give to customers because it provides a good reference of information that customers would refer back to.

Thanks to Shell for sending in the link!

Friday
Apr152011

Client Infographics: Wine iPhone Apps


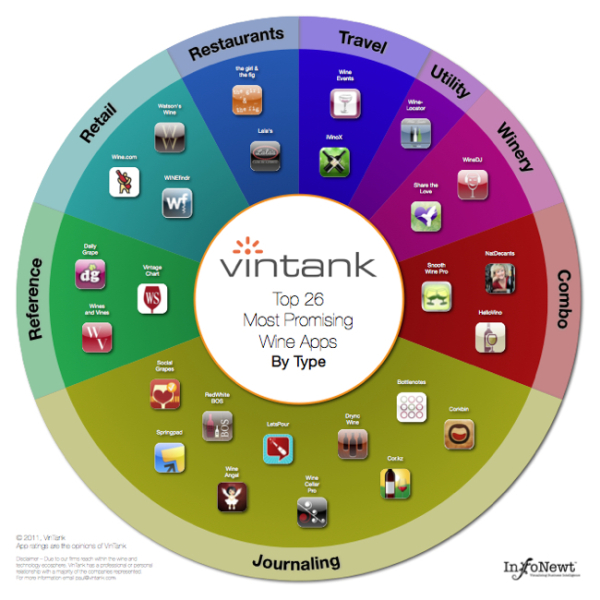
Two infographics InfoNewt (my company) designed recently for the great folks at VinTank.com, a think tank for the wine industry.  Are There Any Good Wine Apps for the iPhone? summarizes the highlights of the data that VinTank gathered from the iTunes Store.  Sorting through 452 wine apps is a lot for a consumer to figure out (intimidating!), so they broke them up by price, rating, business model and type of app.

We took it upon ourselves to evaluate all 452 wine related application available for the iPhone. That is more than six times the amount of wine related applications that was available on our last iPhone Report over a year ago. Each application went through an expansive 20-point inspection that surfaced strengths and weaknesses of their model, UEX, innovation, consumer value, winery value and much more.

You will also notice that we chose do a visual representation of all the data collected, because let’s face it, not only is our attention spans less with amount of content that requires our attention but also because infographics are pretty cool and definitely the trend to display deep rich amounts of numbers, information and data!

The second infographic displays the Top 26 Most Promising Wine Apps, as judged by VinTank.  These are grouped by type of app, and if you view the larger version you can click on any of the icons to be taken to the iTunes page to learn more about the app.

The team at VinTank obviously put a ton of effort into gathering data and evaluating all 452 apps so they could share this information with the public. 

After all that analysis it was clear to us that there were definitely leaders in the mobile space that showed the most promise. It is important to note that some of due to our deep reach within the wine and technology ecosphere, we have professional or personal relationships with a majority of the Top 26 that have been outlined. This however, does not change our view about how exciting it will be to see how all of them continue to improve their platforms and in fact, we excluded many other app companies that we also work with.

The Top 26 spectrum chart is an interactive version where you can learn more about each application and download their app directly should you choose to do so, or if you don’t already have it. Go ahead give it a try!

Even for data very limited to a specific target audience, an infographic is a fantastic tool to make the information interesting and easy to comprehend by the readers. 

Thanks to Paul and Evan for being great to work with.

Friday
Mar252011

Infographic iPhone 5 Rumor Roundup


From the French site, NowhereElse.fr, comes an infographic iPhone 5 Rumor Roundup.  I like how each rumor has an appropriate image, and a rating of how likely they think the feature will make it into the next iPhone.

I posted the English version, but the French version is available here.

A design collaboration between Düne and Sosoa.  (I always appreciate when infographics list the designer(s) so I can also give them credit and links)

Thanks to Miguel for sharing it on Google Buzz!

Friday
Mar112011

What is Data Visualization?


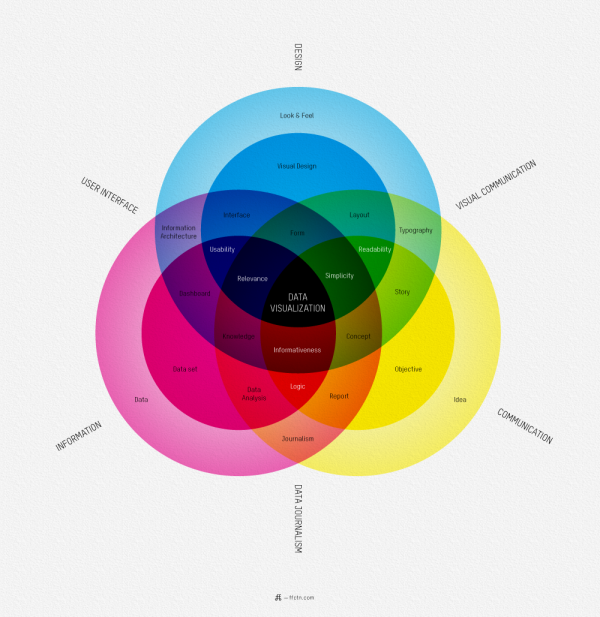
I love this map of What Is Data Visualization? from Sébastien Pierre, founder of ffunction.  It lays out the different aspects of information design, and acts as a fantastic guide to the vocabulary used in the design community.

ReadQWriteCloud has a good interview article with Pierre on his thoughts behind designing the infographic.

Pierre:

“Will it be interactive or static? Will it be used as a tool or to illustrate something? Depending on how we position the visualization, it will be more demanding on UI aspects or on visual aspects. Dashboards, online reports and interactive web visualizations need a solid understanding of UI design, while infographics and print reports require a strong foundation of typography, layout and visual communication.”

Found on ReadWriteCloud and ChartPorn

Friday
Mar042011

Google Data Viz Challenge: Visualize Your Taxes

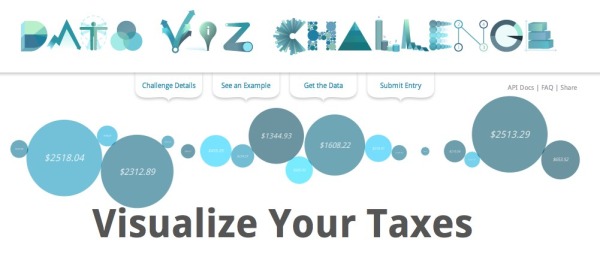
Google has partnered with Eyebeam to sponsor the Data Viz Challenge: Visualize Your Taxes using data provided by WhatWePayFor.com.  I really like the data viz styles used as a font, similar to the Goole Doodles.

Every year, Americans fill out income tax forms and make a payment to the IRS. It’s an important civic duty, but it is also a lot of money. Where does it all go? Using data provided by WhatWePayFor.com, we challenge you to create a data visualization that will make it easier for U.S. citizens to understand how the government spends our tax money.

The Prize: $10,000 in prizes with $5,000 for the top entry.  Winning entries will featured on the DataVizChallenge.org website, the Official Google BlogEyebeam.org and Fast Company’s design blog, Co.Design.

The Deadline: Submit your entries by midnight of March 27, 2011. Finalists will be announced the week of April 11, and winners will be publicly announced on Tax Day (April 18, 2011). 

Participants must be residents of the U.S., which is an issue for many would-be designers.

Found on Infographics News, VizWorld and Infosthetics

Thursday
Mar032011

The Infographic History of SxSW

To help commemorate the 25th birthday of the South by Southwest (SxSW) conference this year, Eloqua teamed up with JESS3 to create this huge circular timeline.  Memorable moments and events are described around the outside, while the attendance of the three main conference topics (music, film, interactive) are visualized in the middle.  It was so large, i had to drop it into Zoom.it to make it interactive.  You can download the high-resolution PDF file here.

we collaborated with design partner JESS3 to produce an infographic, titled “The History of SXSW,” which celebrates the festival’s impact on the cultures of music, film and technology.  We also dug up (and visualized) a massive number of did-you-know facts about the epic festival.

SxSW started in 1986 with only 700 people attending, but has exploded in the last few years to draw in over 36,000 people to Austin, TX.  This year, SxSW will be held March 11-20.

Thanks to Abby for sending it in, and it was also a very popular post on Mashable.