About
Randy Krum
President of InfoNewt.
Data Visualization and Infographic Design

Infographic Design

Infographics Design | Presentations
Consulting | Data Visualizations

DFW DataViz Meetup

Join the DFW Data Visualization and Infographics Meetup Group if you're in the Dallas/Fort Worth area!

Search the Cool Infographics site

Custom Search

Subscriptions:


Feedburner

The Cool Infographics® Gallery:

How to add the
Cool Infographics button to your:

Cool Infographics iOS icon

- iPhone
- iPad
- iPod Touch


Read on Flipboard for iPad and iPhone

Featured in the Tech & Science category

Flipboard icon

Twitter Feed
From the Bookstore

Caffeine Poster

The Caffeine Poster infographic

Entries in Visualization (49)

Sunday
Feb222015

Cool Infographics Course at SMU

Cool Infographics Course at SMU

Infographics & Data Visualization Design

April 7-May 19, 2015 | 6am-9pm Tuesday Evenings | SMU CAPE Dallas Campus | $495

$50 off discount code for Cool Infographics readers: VIP50

I will be teaching a new course at the SMU Dallas Campus this spring as part of the CAPE program (Continuing and Professional Education). In this course, working professionals will become familiar with the exciting and expanding field of data visualization and infographics. By attending this course you will start to develop your own portfolio and learn:

  • The art and science of data visualization and infographics
  • The data visualization and infographics design process
  • Data analytics and basic statistics for the designer
  • Different chart types, dashboards and graphing options
  • How to use the various software and online tools readily available and when to use them
  • Strategies for publishing and promoting infographics online
  • Understanding IP, trademark and copyright issues and how they relate to infographics
  • And more…

Please share with anyone in the Dallas area, or join the class yourself. Enrollment is very limited, so register quickly!

Click Here to learn more: bit.ly/SMU-DataViz


Also check out the DFW Data Visualization & Infographics Meetup group with monthly speakers and events in the Dallas-Fort Worth area!

Wednesday
Dec242014

The Graphic Continuum - Desktop Version

The Graphic Continuum - Desktop Version

Jon Schwabish and Severino Ribecca have released a full-color, double-sided, laminated 8.5”x11” desktop version of The Graphic Continuum, available for only $10 until the end of the year when the price will go up to $13. This is a smaller version of The Graphic Continuum poster they released earlier this year.

Nearly 90 graphic types grouped into 6 categories on a laminated 8.5”x11” sheet. It does not include every type of graphic, nor does it display every type of link between visualization, but it serves as a thought-starter. Use it to develop ideas, consider different options, or simply as a piece of art.

A fantastic reference of data visualization methods to give you some ideas for ways you can visualize your data differently.

The Graphic Continuum - Desktop Version Page 1

The Graphic Continuum - Desktop Version Page 2

Thursday
Dec042014

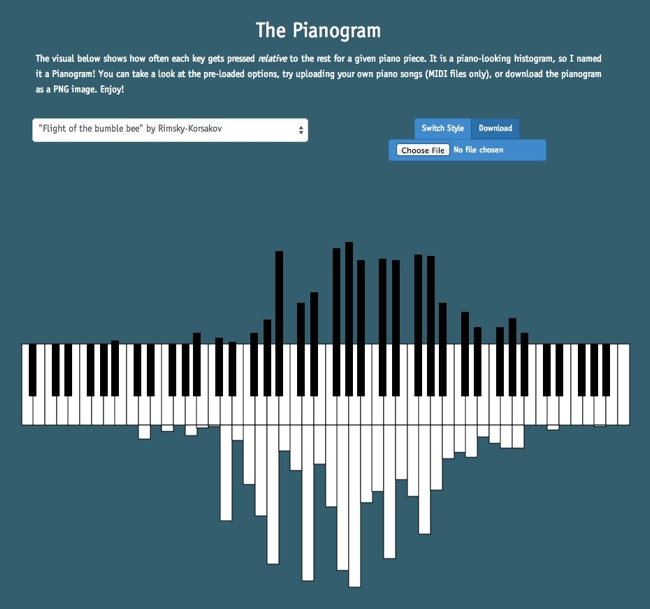
The Pianogram

The Pianogram Joey Cloud infographic

The Pianogram is a histogram using the design style of a piano keyboard to show the frequency of notes in a given song. Designed by software programmer Joey Cloud, the site has a handful of preloaded songs, but you can upload the MIDI file for any song to create a custom pianogram.

The visual below shows how often each key gets pressed relative to the rest for a given piano piece. It is a piano-looking histogram, so I named it a Pianogram! You can take a look at the pre-loaded options, try uploading your own piano songs (MIDI files only), or download the pianogram as a PNG image. Enjoy!

This a fun visualization tool. Here’s Billy Joel’s Piano Man, just because it seemed the most appropriate:


The Pianogram Billy Joel Piano Man

Found on FlowingData and FastCo Design

Monday
Oct202014

DFW Data Visualization & Infographics Meetup Group

DFW Data Visualization & Infographics Meetup Group

Announcing the launch of the local DFW Data Visualization & Infographics Group through Meetup.com. The group is free to join, and I’m partnering with SMU CAPE to provide us with a location to meet in the Dallas-Fort Worth area. If you’re in the area, please join and share the group with your friends and coworkers!  We strive to be a group of visualizers that includes a mix of marketers, entrepreneurs, managers, researchers, teachers, scientists and of course designers. Anyone that deals with presenting or communicating data.

I’m also looking for potential speakers and future event ideas, so let me know if you, or anyone you know, would be interested in engaging with this group. I would love to schedule a full range of beginner to advanced topics covering data visualization, data communication, infographics, data analysis, charts and graphs, presenting data, visual marketing, infographic resumes, content marketing and more!

Our first event will be November 12th in the SMU CAPE building (Continuing and Professional Education). I’ll give a presentation sharing many Innovative Ways Companies are Using Infographics, and the group will have an open discussion about the kinds of speakers, topics and events that we would like to see from this group in the future.

We are also looking for interested partner companies to help sponsor the group by providing refreshments, event locations or funding for future group events and speakers.

If you love the idea, but aren’t in the DFW area, check out these other great DataViz Meetup Groups across the country:

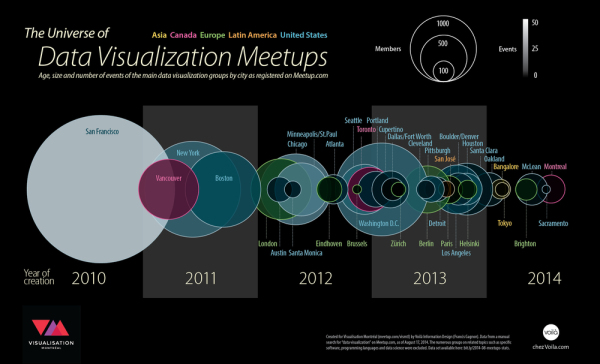
Also, check out The Universe of Data Visualization Meetups infographic which a great visualization design by Voilà Information Design in Montréal, Canada to find many more active groups.

The Universe of Data Visualization Meetups infographic


Friday
Oct102014

5 Great Online Tools for Creating Infographics

Professional infographic designers rely primarily on a core vector graphics software program to create their infographics designs. The main advantage is that all the icons, charts, images, illustrations, and data visualizations are treated as separate objects that can be easily moved, resized, overlapped, and rotated. No matter where you create the individual design elements, the final infographic design is usually put together in a vector graphics program.

Creating infographics using online tools has never been easier. In the last few years a number of online tools have emerged that allow anyone to create great visual content.  Whether you are working on a project for work, personal use, or social media, each new project starts with a template. With the dimensions laid out for you, you can focus your attention on quickly creating effective designs. Search, drag, and publish - it can be that simple.

These new tools are vector graphics applications that run in your browser as a replacement for using an expensive professional desktop application like Adobe Illustrator to put your infographic design together.  Each one offers different tools, image libraries, charts, fonts and templates as a starting point.  None of these have the full capabilities of a professional desktop application, but you probably don’t need that much power to create a simple infographic.

In this article, we take a quick look at 5 of the best online tools for creating infographics: Visme, Canva, Easel.ly, Piktochart, and Infogr.am. All of these tools are evolving quickly, and this is just a snapshot of their current capabilities.
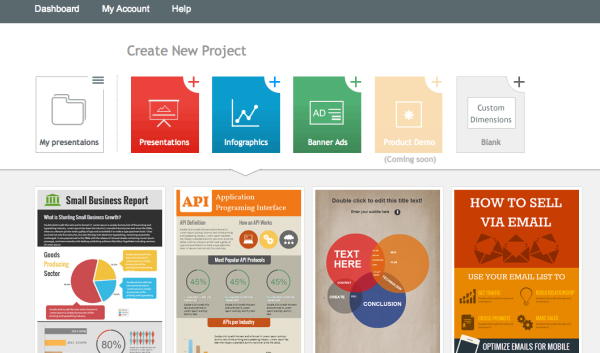
 

Visme screenshot

1) Visme (visme.co)

Visme allows you to create interactive presentations, infographics and other engaging content. With tons of templates, and huge library of free shapes & icons to choose from, Visme has you creating awesome visual content right away.

The templates are set up simply and beautifully. If you wanted, you could just edit the placeholder text, insert your own, and publish your infographic.

One of the greatest aspects of this service is changing percentages within the charts. All you have to do is click on the graphic you would like to change, enter a new number, and the chart changes to reflect the new information automatically. Saving you hours of frustration trying to do it on your own.

Pros:

  • Creates infographics, presentation, animations, ad banners, and custom layouts.

  • Insert and edit chart objects directly by changing the data values.

  • Large library of icons and images.

  • Embed YouTube videos directly into designs.

  • Special pricing for students & teachers.

Cons:

  • The basic free version is limited.

    • Only 3 projects.

    • Must include the Visme logo.

    • Limited access to charts and infograph widgets.

  • JPG download is still in Beta, with a few bugs.

Price: Basic version is free with pricing plans available
 

Canva screenshot

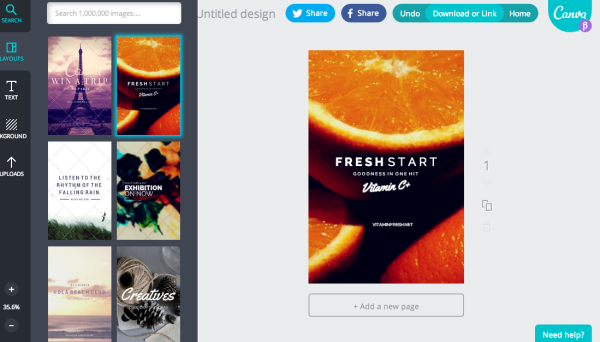
2) Canva (canva.com)

Canva just celebrated their 1-year anniversary last month, and has made a big splash in the online design space.  Your experience kicks off with a great "23 Second Guide to Beautiful Design," where they walk you through a brief introduction to their design program.

After finishing the brief tutorial, you can start a new design. Canva is filled with options, whether you are working on a project for work, personal, or social media. Each new project comes with a template for the project you choose to work on. With the dimensions done for you, you can focus your attention on creating beautiful designs in seconds.

Pros

  • Excellent (and short) intro tutorial to get you started, and many more on advanced concepts.

  • Templates for social media, blogs, presentations, posters, business cards, invitations, and more.

  • Easy and intuitive to use.

  • Large library of images to choose from.

Cons

  • No editable chart objects. You need to import your own data visualizations as images.

  • Have to pay for different image assets individually, instead of a monthly subscription.

Price: Free, but you have to pay for Pro quality design assets individually
 

Easelly screenshot

3) Easel.ly (www.easel.ly)

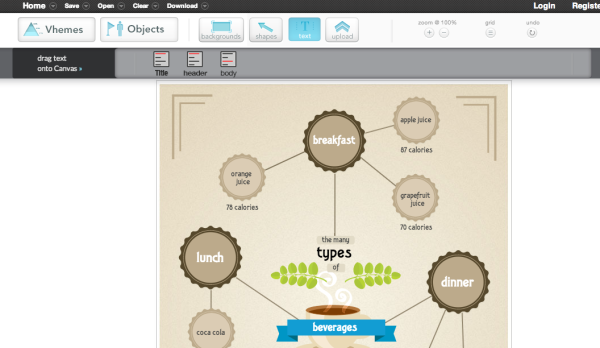
Easel.ly is a great program, but lacks some of the guidance, and features, that come standard in other programs.

Easel.ly lacks a "How-To" introduction section to their program, and just kind of throws you into the design process right away. Their focus seems to be primarily based on infographic design. Whereas other programs offer a plethora of design project options.

If you're just looking to design an infographic, this program will work well. If you want more variety, you'll have to utilize one of the other programs in this list.

Pros:

  • Free.

  • Very basic design layouts and assets.

  • New charts feature allows some basic editable charts in your design.

  • Easy downloads for JPG and PDF versions.

Cons:

  • Not a very large selection of themes, called “Vhemes”.

  • Small library of image assets. You’ll want to upload your own images and icons.

Price: Free
 

Piktochart screenshot

4) Piktochart (piktochart.com)

Piktochart is one of the best looking programs on this list. All the information you need to get started is provided in their tour.

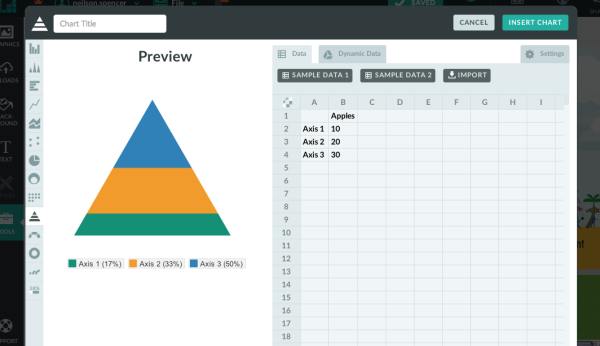
Their program is easy to use, and offers tons of freedom in building and editing your infographic using their simple graphic tools. They have categorized icons, resizable canvas, design-driven charts, and interactive maps to utilize.  

Their intuitive user interface is where Piktochart truly excels. All the tools you need to create are laid out intelligently, making your new job as a "designer" so much easier.

One of the coolest aspects of this program is that they show how versatile infographics are for different projects. Whether you're creating for a classroom, office, website, or social media setting - Piktochart gives you the heads up on how to use infographics effectively.

Pros:

  • Themes and templates are of high design quality.

  • Intuitive. Allows you to edit anything and everything with ease.

  • Create infographics, reports, banners and presentations.

  • Embed videos from Youtube and Vimeo in your design.

Cons:

  • Limited selection of free templates. Higher quality templates are available with a Pro account.

  • $29 per month is a high subscription price compared to the others.

Price: Start for free with pricing packages available
 

Infogram screenshot

5) Infogr.am (infogr.am)

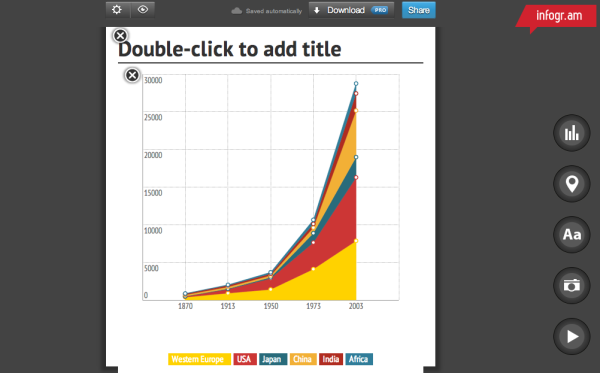
Infogr.am has got the best charts. For illustrating data, there are more than 30 different types of charts to choose from. Anything from bubble charts and tree maps to simple pie charts.

Editing data can be easily done in Infogr.am's built-in spreadsheet, or you can import your own XLS, XLXS and CSV files.  Once your infographic has been edited and beautifully designed, you can save it to your computer as a PNG or PDF file with a paid subscription.

Pros:

  • Ability to create and edit great charts by changing data

  • Built-in Spreadsheet. Can also import your XLS, XLXS and CSV files

  • Widest variety of available chart types

  • Educational and Non-profit pricing plans available

  • Embed videos from Youtube and Vimeo in your design.

Cons:

  • Only creates infographics and charts

  • Small selection of infographic templates

  • No image library, you must upload your own image assets

  • Download options require paid subscription

  • The White Label subscription service is the most expensive options of the group

Price: Basic version is free with pricing plans available


Which design sites have you tried? Which tools are your favorites? Post in the comments.

Friday
Oct032014

The Graphic Continuum

The Graphic Continuum data visualization poster

The Graphic Continuum is a new poster of data visualization styles and methods from Job Schwabish and Severino Ribecca. Available as a printed poster for $25 on Mimeo.

The Graphics Continuum shows several ways that data can be illustrated individually or combined to show relationships. Use of various shapes, chart types, and colors can help identify patterns, tell stories, and reveal relationships between sets and types of data. Bar charts, or histograms, for examples, can illustrate a distribution of data over time, but they also can show categorical or geographic differences. Scatterplots can illustrate data from a single instance or for a period, but they also can be used to identify a distribution around a mean.

This set of charts does not constitute an exhaustive list, nor do the connections represent every possible pathway for linking data and ideas. Instead, the Graphic Continuum identifies some presentation methods, and it illustrates some of the connections that can bind different representations together. The six groups do not define all possibilities: Many other useful overlapping data types and visualization techniques are possible.

This chart can guide graphic choices, but your imagination can lead the way to other effective ways to present data.

The Graphic Continuum data visualization poster closeup 1

I’ve seen a few other attempts to gather and categorize data visualization techniques, and I really like this poster. One of the biggest challenges for people is to break out of the Big Three chart styles: bar charts, line charts, and pie charts. It doesn’t matter if they’re designing an infographic or a PowerPoint presentation, I am often asked to help clients find new ways to visualize their data.

The Graphic Continuum data visualization poster closeup 3

Jon Schwabish has posted a great article on Visual.ly about the development process and includes images of some other arrangements they attempted during the design process.


Tuesday
Sep162014

Beer Colors

Beer Colors Cans Visualization Infographic

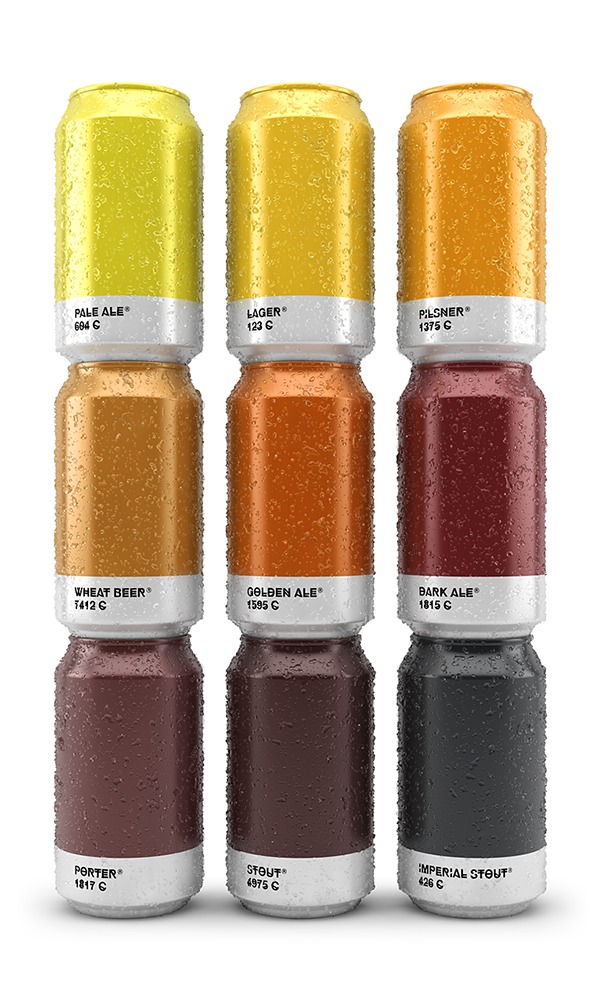
Beer colors is a fun design idea that combines packaging design with beer label design, these beer label designs imitate Pantone® color chips.  Maybe more of a data visualization of colors than a true infographic, but I love it!

Concept and design based on the color of the beer. Each type of beer is associated with its corresponding Pantone color. The typeface chosen is HipstelveticaFontFamily in its bold version by José Gomes, thanks for sharing.

Designed by Spanish creative agency Txaber, this series of beer packaging labels show each brew type represented by its corresponding official color. 

Beer Colors Bottles Visualization Infographic

Found on creativebloq and BoingBoing


Thursday
Sep042014

Abby & Chris: Wedding Invitation

Abby & Chris: Wedding invitation

Another fun way to spruce up your life with visuals! The Abby & Chris Wedding invitation from Abby Ryan Design takes an ordinary wedding invitation, and makes it extraordinary with data v visualization Fun idea! Maybe try it out for your next party?!

Abby & Chris: Wedding invitation

This illustrative wedding package was designed to reflect the playfulness of Abby and Chris’s food truck wedding. First, a 18 x 24 screen printed wedding infographic that works as an invitation, program and menu. The poster was designed with the rehearsal dinner invitation as the bottom section so it could be removed for guests only coming to the wedding. Next, the save the date card, which focuses on important events in Abby and Chris’s relationship with the final date being their wedding. A wedding website was also created to keep their guests informed.

This is fun and original. A keepsake for all the guests! It also gives a lot more useful information than most wedding invitations!

Thanks to Abby for sending in the link!

Friday
Aug292014

False Visualizations: Sizing Circles in Infographics

Accuracy is the most important aspect of an infographic design!

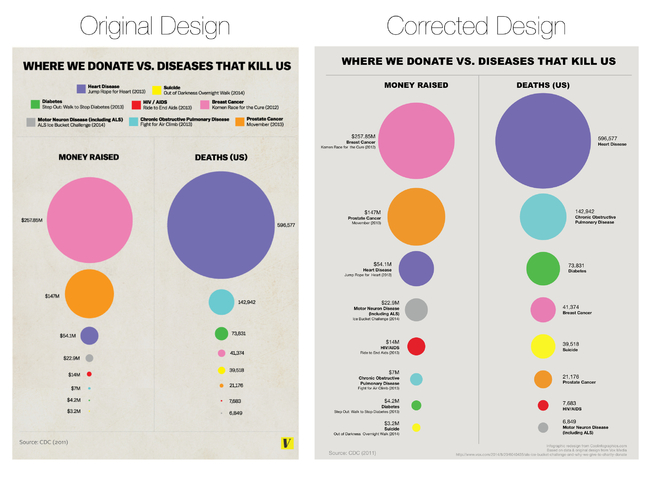
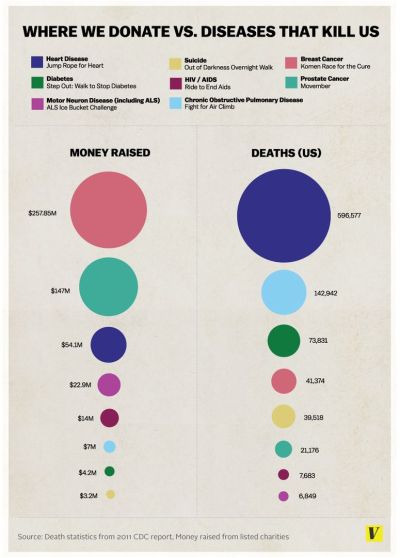
Last week, the article The Truth about the Ice Bucket Challenge by Julia Belluz on Vox Media included the infographic, Where We Donate vs. Diseases That Kill Us, that used proportionally sized circles as its data visualization. The problem with this design is that the circle sizes don’t match the values shown. This is a false visualization and significantly over exaggerates the smaller amounts of money contributed to each charity and the deaths attributed to each cause.

This causes problems because readers often just look at the visuals without reading the actual numbers. They start with the assumption that a visualization accurately represents the data. The Vox Media story and infographic already have over 12,000 shares on Facebook, and this is a great case study for designers to understand how important it is to visualize data accurately.

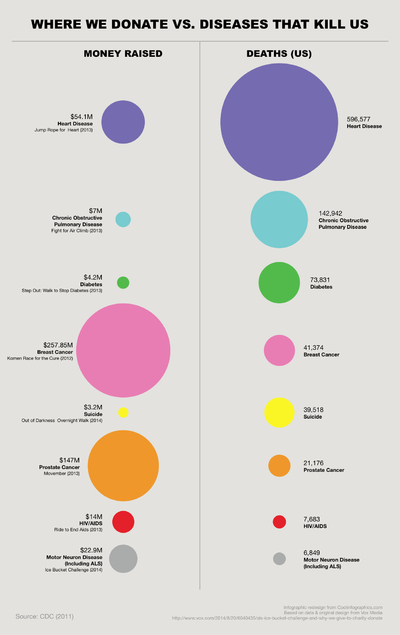
As readers, we see the area of two-dimensional shapes on the page to represent the different values, but design software only allows width and height adjustments to size shapes. Designers make the mistake of adjusting the diameter of circles to match the data instead of the area, which incorrectly sizes the circles dramatically. It takes some geometry calculations in a spreadsheet to find the areas and then calculate the appropriate diameters for each circle. To demonstrate, I created this corrected version of the infographic.

False Visualizations: Sizing Circles in Infographics Revised

My Google Docs spreadsheet of the correct circle area and diameter calculations is available here.

Assuming this was a design mistake, and there was no intent to deceive the audience, this is a common mistake that many designers make.  So many designers, that I included an entire section on this topic in the Cool Infographics book to help designers understand how to size the area of circles.

I made one other improvement to the corrected design above by removing the color legend and listing the charities and causes of death right next to the appropriate circles. This makes the whole visualization easier for the audience to read by eliminating the need to look back-and-forth from the circles to the color legend to figure out what each circle represents.  Placing the text next to each circle keeps the information in the reader’s field of view which minimizes eye movement.

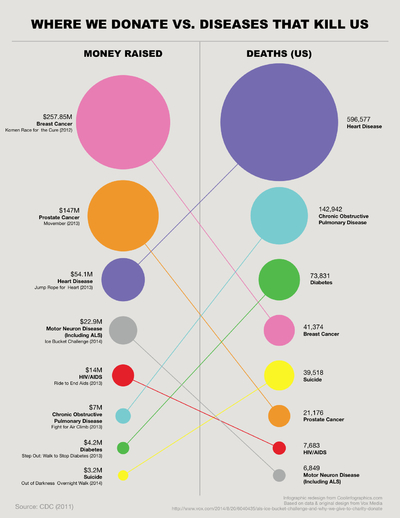
Sticking with the circles data visualization style, I wanted to take the design a little bit further. I would recommend one of two alternate improvements.  First, adding colored connecting lines is one way to make it easier for the audience to find the related circles in the columns sorted in descending order.

False Visualizations: Sizing Circles in Infographics Revised Lines

A second alternative would be to sort the lists to line up the related circles.  This makes it much easier for the audience to see the direct comparisons between charitable contributions and death rates related to the same cause.

False Visualizations: Sizing Circles in Infographics Revised Descending Sort

I’m passing over any discussion about whether using proportionally sized circles (a bubble chart) is the best visualization method for this data. If a designer makes the choice to use sized shapes, my point is that the data visualizations in the infographic must match the numbers using area.  David Mendoza published a good analysis worth reading and designed an alternative way to visualize the data in his article, This Bubble Chart Is Killing Me.

How else would you improve this design?

NOTE: I was able to contact the designer who created the infographic at Vox Media, and he had already realized his error after the infographic had been published. As I had guessed, he had mistakenly adjusted the diameter of the circles instead of the area. He told me that he’s working on updating the official infographic design in the article, but it hasn’t been published on the Vox Media site yet.


Tuesday
Aug192014

Voice of the Photographer: Photographers Actively Engaged in Growing Skills

Voice of the Photographer: Photographers Actively Engaged in Growing Skills infographic

The field of Photography evolves quickly due to advances in technology. Eyefi has uncovered the latest trends in the field and have organized them into the Voice of the Photographer: Photographers Actively Engaged in Growing Skills infographic.

There’s just no arguing that today’s most prominent photographers are evolving at the speed of technology. Those that remain relevant do so by merging their visual talents with the latest advances, like WiFi SD cards, cloud storage, and new ways of lighting and photo manipulation.

Photographers at the top of their game must maintain a staunch dedication to continuous improvement as well. Thankfully, the web provides a bevy of opportunities to hone their craft, from top-ranking bloggers to photography-focused online magazines.

To find out exactly how and where today’s best photographers are expanding their knowledge base, Eyefi.com, creators of innovative WiFi cards, apps, and cloud services, in partnership with influencer marketing agency Evolve!, reached out to their accomplished user base with a myriad of relevant questions. The results showcase where the most influential photographers online are spending their time, money, and efforts to advance their abilities. Some are professionals, while others are hobbyists; but all these folks know how to move us with their visual storytelling skills. Check out the fascinating infographic below to learn more about the photography world’s current ever-evolving habits and trends.

I love seeing all of this survey research data shown in a visual, infographic form.  It’s so much more engaging and easier for the audience to understand.

When visualizing data with grids of icons, rows with 10 icons across are the easiest for your readers to understand.  This design includes some odd row quantities like 12, 13 and 20 icons across, which are not intuitive to the audience.  Our number system is Base-10, and icons shown in groups of 10 are the easiest to comprehend.

Thanks to Katie for sending in the link!