About
Randy Krum
President of InfoNewt.
Data Visualization and Infographic Design

Infographic Design

Infographics Design | Presentations
Consulting | Data Visualizations

DFW DataViz Meetup

Join the DFW Data Visualization and Infographics Meetup Group if you're in the Dallas/Fort Worth area!

Search the Cool Infographics site

Custom Search

Subscriptions:


Feedburner

The Cool Infographics® Gallery:

How to add the
Cool Infographics button to your:

Cool Infographics iOS icon

- iPhone
- iPad
- iPod Touch


Read on Flipboard for iPad and iPhone

Featured in the Tech & Science category

Flipboard icon

Twitter Feed
From the Bookstore

Caffeine Poster

The Caffeine Poster infographic

Entries in comparison (73)

Monday
May112015

History of the Batmobile

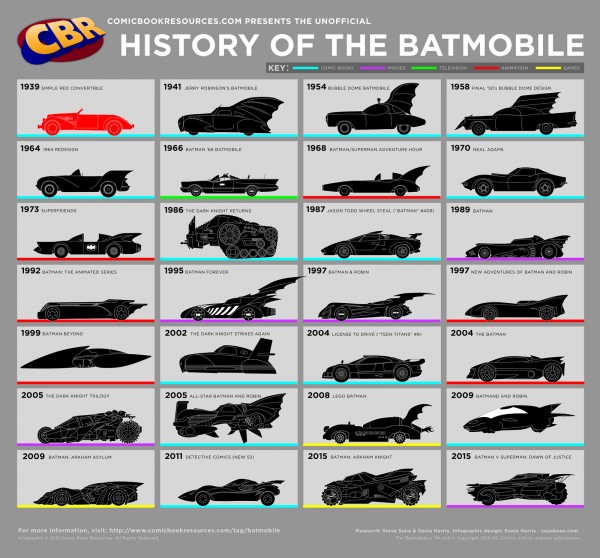
History of the Batmobile infographic

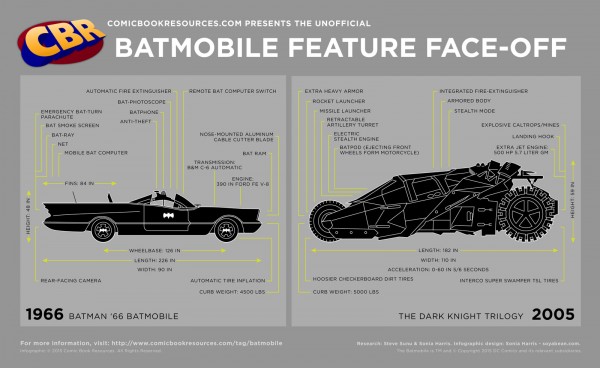
Batmobile Feature infographic

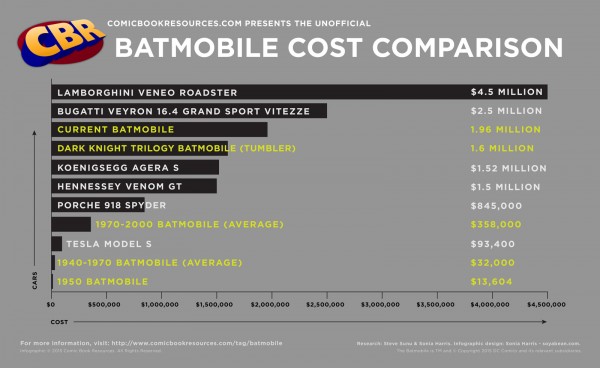
Comic Book Resources has added 3 Batmobile infographics to reveal some interesting trivia. In 75 years, there have been many different Batmobiles over the years. These infographics show past designs, a feature comparison between the 1966 and 2005 model, and final a cost comparison chart ranging from the $13,000s to $4.5 Million.

After 75 years of omnipresence, one can make a very strong case that the Batmobile is the most iconic automobile in all of pop culture history. Since Batman’s debut back in 1939’s “Detective Comics” #27, the caped crusader has always relied on a car — usually a stylish, feature-loaded one — to get him from his cave to crime scenes. As a crucial part of the Bat-mythos, the Batmobile — dubbed such in 1941’s “Detective Comics” #48 — has appeared in everything from comics and cartoons to films and video games. Wherever you see Batman, odds are the Batmobile is parked just a few blocks away. 

Zack Snyder Shares Partial Look at New Batmobile

With the Batmobile poised to make it’s eighth big-screen appearance in 2016’s “Batman v Superman: Dawn of Justice,” former CBR editor Steve Sunu set about researching the most intimidating car on DC Comics’ streets. Did you know that the original Batmobile was red? Or that the “Batman ‘66” version had an “emergency bat-turn parachute”? Or that you could buy almost three “Dark Knight” tumblers for the cost one one Lamborghini Veneno Roadster? Graphic artist and COMICS SHOULD BE GOOD contributor Sonia Harris brought all these facts together in the three infographics below, designed to get you up to speed on the fiction’s most notable car.

Peruse CBR’s three Batmobile infographics and broaden your knowledge of comics’ most famous car — and feel free to share and discusses these infographics on social media with #CBRBatmobile!

I would have put all three of these together into one infographic, but the smaller, separate designs might be easier to share in social media. In the Cost Comparison bar chart, I would like to see images or silhouettes of the different cars represented.

Thanks to Mike Wirth for sharing on Facebook.

Friday
Mar272015

How to Build a Website in 2015

How to Build a Website in 2015 infographic

Do you have plans to build a website soon? There are three major different workflow styles. How to Build a Website in 2015 from Rukzuk has shown the 3 most popular workflows so that you can pick the style that fits your skills.

There’s tons of different ways to get from client briefing to a live, working website. We’ve put the three most popular workflows up against each other. What’s your workflow of choice?

Simple clean design that does a good job of comparing the three different workflows without overwhelming the reader with too much information. Great job with the Creative Common license and complete list of data sources!

Found on Rukzuk.com

Monday
Feb162015

Easy Longboard Buyer's Guide

Easy Longboard Buyers Guide infographic

If you are new to the longboard scene, or just need a little help learning exactly what you need, the Easy Longboard Buyers Guide infographic from Longboard Reviews could be a life saver. This cheat sheet tells you the differences between the board styles, wheel sizes, wheel hardness, and deck length.

Thinking of buying a longboard? Use this easy-to-follow guide to discover exactly which is the best type of longboard for the riding style you enjoy.

Need to know what trucks, deck or wheels to buy? This guide will help you with that too.

If you are new to longboarding then all the different types of decks, trucks, wheels and bearings can be quite daunting. It seems like there is a minefield of choices out there. Do I want hard wheels or soft wheels? A concave deck or a drop-through deck?

Accidentally buy a slalom board for cruising and you’ll be in trouble!

In my guide (on the left hand side) I have made it really easy for you. Simply decide which type of riding style you want to do and I’ll show you exactly what type of board to buy.

Once you have done that, head over to my reviews page and discover which is the best longboard on sale at the moment for your needs.

This is a really good side-by-side comparison style design. The mix of actual photo images with the illustrations to visualize the data works very well, and adds a lot of credibility to the design.

The URL in the footer, should be the link to the infographic landing page so readers can find the original full-size version. The infographic is nowhere to be found on the front page, which would make readers frustrated by trying to search the site.

Thanks to Jon for sending in the link!

Monday
Feb092015

The Massive SciFi Starship Size Comparison Chart

The Final SciFi Starship Spaceship Size Comparison Chart infographic

The massive SciFi Starship Size Comparison Chart is one of my favorite infographic design projects. Designed by Dirk Loechel and shared on DeviantArt, this is a project he has been working on for years. I posted an earlier version of his design in 2013 here which was hugely popular. Dirk’s notes claim that this may be the last update.

The last update

For real this time: This is the final major content update, though if there are issues I’ll still fix them. I also haven’t forgotten I wanted to vectorize the writing. It’s still on the radar. But content-wise, I think that is about all I can put in. 

Also, I added the ISS. For scale. It’s on top, with a yellow frame so it’s relatively easy to find.

Lots of errors fixed, lots of new ships too. Well, off for now, but I’ll be replying in the comments more or less regularily. 

This is probably at least for the forseseeable future the last round of adding ships. I have pretty much all I wanted now (excepting some old scifi, and many Anime series, which tend to not have many usable images). Lots of new content.

And that’s it for now. Enjoy the new-and-improved chart! 

This is one of the visual designs that clearly demonstrates why visuals can be much more effective than text descriptions. Especially when it comes to comparing size and scale. You just don’t comprehend the scope when someone tells you that the Star Wars Executor Class Super Star Destroyer is 19,000 meters long. You have to see it in comparison to something you already know.

The images on DeviantArt are high enough in resolution, that you can download and print it out as a poster yourself to hang on your wall. The full-size poster resolution is 4,268 x 5,690 pixels. Most of the ships are clustered by franchise (Star Wars, Star Trek, Halo, Eve, Warhammer, etc.). As a reality check, the International Space Station (ISS) is included for reference.

Found on Geyser of Awesome, Nerd Approved and Nerdist

Friday
Sep192014

Marketing Artists vs. Marketing Scientists

Marketing Artists VS Marketing Scientists infographic

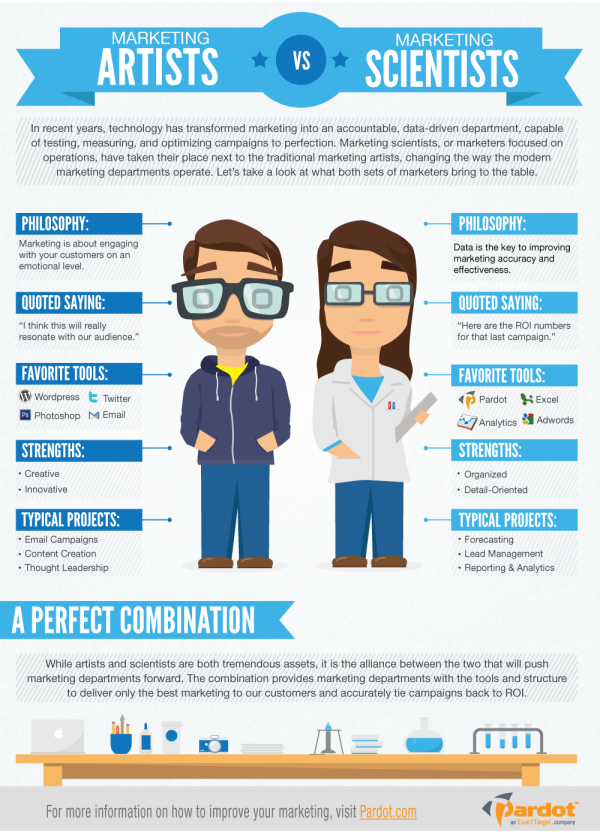
The Marketing Artists vs. Marketing Scientists infographic from Pardot highlights the assets of both kinds of marketers in the modern age. But the alliance between the two groups will create the best end product.

In a great article published last week, Stan Woods of Velocity Partners offered his thoughts on how fast marketing has developed over the past few months, and the new marketing roles this change has created.

In his closing paragraph, Woods distinguishes between the creative-driven and data-driven marketers by referring to them as “marketing artists” and “marketing scientists,” respectively. Although a slight oversimplification, these distinctions hold a lot of truth about the current divide that exists within many marketing departments.

Technology has given marketers the ability to track, quantify, and optimize marketing processes at a level that was unheard of only a year ago. The marketing scientist has come to dominate this new arena of objective measurement and data-driven thinking, while the marketing artist continues to thrive on creative ideas and a more abstract way of thinking.

But while these two differently-minded marketers may sometimes disagree over where the focus should lie,  the marketing departments that will truly excel in this new age of marketing are those that recognize the value in both approaches. We have put together the infographic below to help highlight the tremendous assets marketing artists and marketing scientists can bring to the table, and the advantage of finding a balance between the two.

This is a purely informational design with no numerical data, but tells a good story. There are two aspects to marketing represented by the illustrated personas. I would prefer less text and more icons or illustrations, but the infographic does a great job of telling one story really well.  That keeps the design short, easy to share and easy to read.  The dominant central visual is also appealing and attracts attention.

The footer should include the URL to the infographic landing page, not just Pardot.com.  When readers come looking for the full-size version, don’t make them search your site for it.

Found on http://www.business2community.com/

Wednesday
Aug202014

Why are Superior's Cotton Threads 'Superior'?

Why are Superior's Cotton Threads 'Superior'? infographic

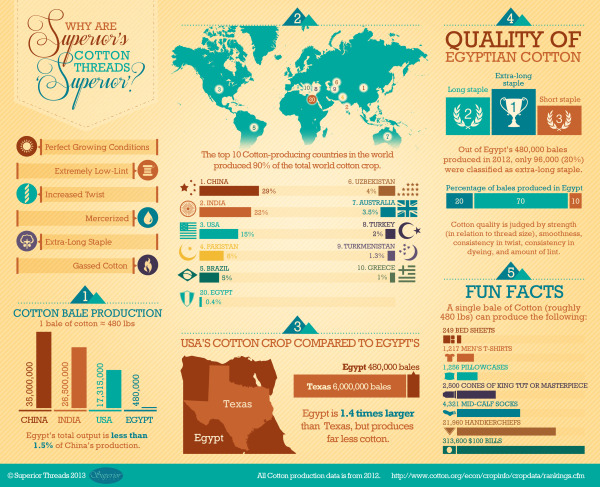
An infographic with information about Superior’s cotton from Egypt, Why are Superior’s Cotton Threads ‘Superior’? created by Superior Threads. This infographic focuses on comparing Egypt’s cotton to other cotton growing countries.

We created an infographic which explains why Egyptian-grown Cotton is so fantastic. Our Cotton threads are truly made from Cotton plants which are grown and harvested in Egypt.

Egyptian-grown extra-long staple Cotton

We put a lot of emphasis on ‘Egyptian-grown extra-long staple’ as a description for our Cotton threads. This is because the highest quality cotton available is Egyptian-grown extra-long staple Cotton when it comes to the textile/thread industry. ‘Extra-long staple’ means less lint and stronger thread. Egypt has the perfect growing conditions for Cotton and the result is a naturally strong and beautiful fiber.

The infographic gets straight to the point with answering its question about what makes Superior’s cotton so great. You can see in the text blurb above that Superior’s cotton comes from Egypt; however, it is not stated anywhere in the infographic.  So that information is lost when people share the infographic by itself.  Infographics take on a life of their own online, and all of your information needs to be included in that image file.

This is a great example for product companies.  Every product has a story about what consumer need it fills, or how it compares to the competition.  Companies should be using more infographic to help tell those stories to their potential customers. 

Thanks to Betsy for sending in the link!

Thursday
May222014

Hack Your Grill

Hack Your Grill infographic

Are you planning on grilling for Memorial Day? Check out the recommended cooking instructions for your meal with the Hack Your Grill infographic from Column Five.

With Memorial Day weekend right around the corner, we can’t wait to get our beer and BBQ on. But mastering the grill can be tricky, whether it’s raw veggies or red meat. To help us crack the code, we created the helpful infographic to make sure everything cooks at the right temperature and time.

Column Five created this guide to average cook times to take the guesswork out of grilling. The guide provides average times for a wide variety of beef, poultry, pork, and vegetable items you might plan on throwing on the grill this summer—all you’ll need is a watch and a meat thermometer.

An easy-to-read, clear guide to grilling times, this design does a great job of focusing on telling one story really well.

The tall format design works really for sharing online, but I would bet that many people will want to print this out as a cooking reference.  It would be nice to have a separate PDF version that breaks the design into two printable pages that readers can print out to keep near the grill.

I would recommend two things to improve the information included in the footer.  First, the sources list only shows the main URL of the sites where the data came from.  This means that any readers would have to search for the information themselves on those sites.  It would be more transparent to list the URL directly to the report or web page that shows the specific data used in the infographic.  

Second, the footer should include the URL directly to the infographic landing page on the Column Five site.  Sadly, many blogs and sites will share an infographic without appropriately linking back to the infographic landing page, and by putting the URL in the infographic itself readers will always be able to find the original.

Thanks to Column Five for sending in the infographic! 

Wednesday
May142014

The Drone Survival Guide

Drone Survival Guide infographic poster

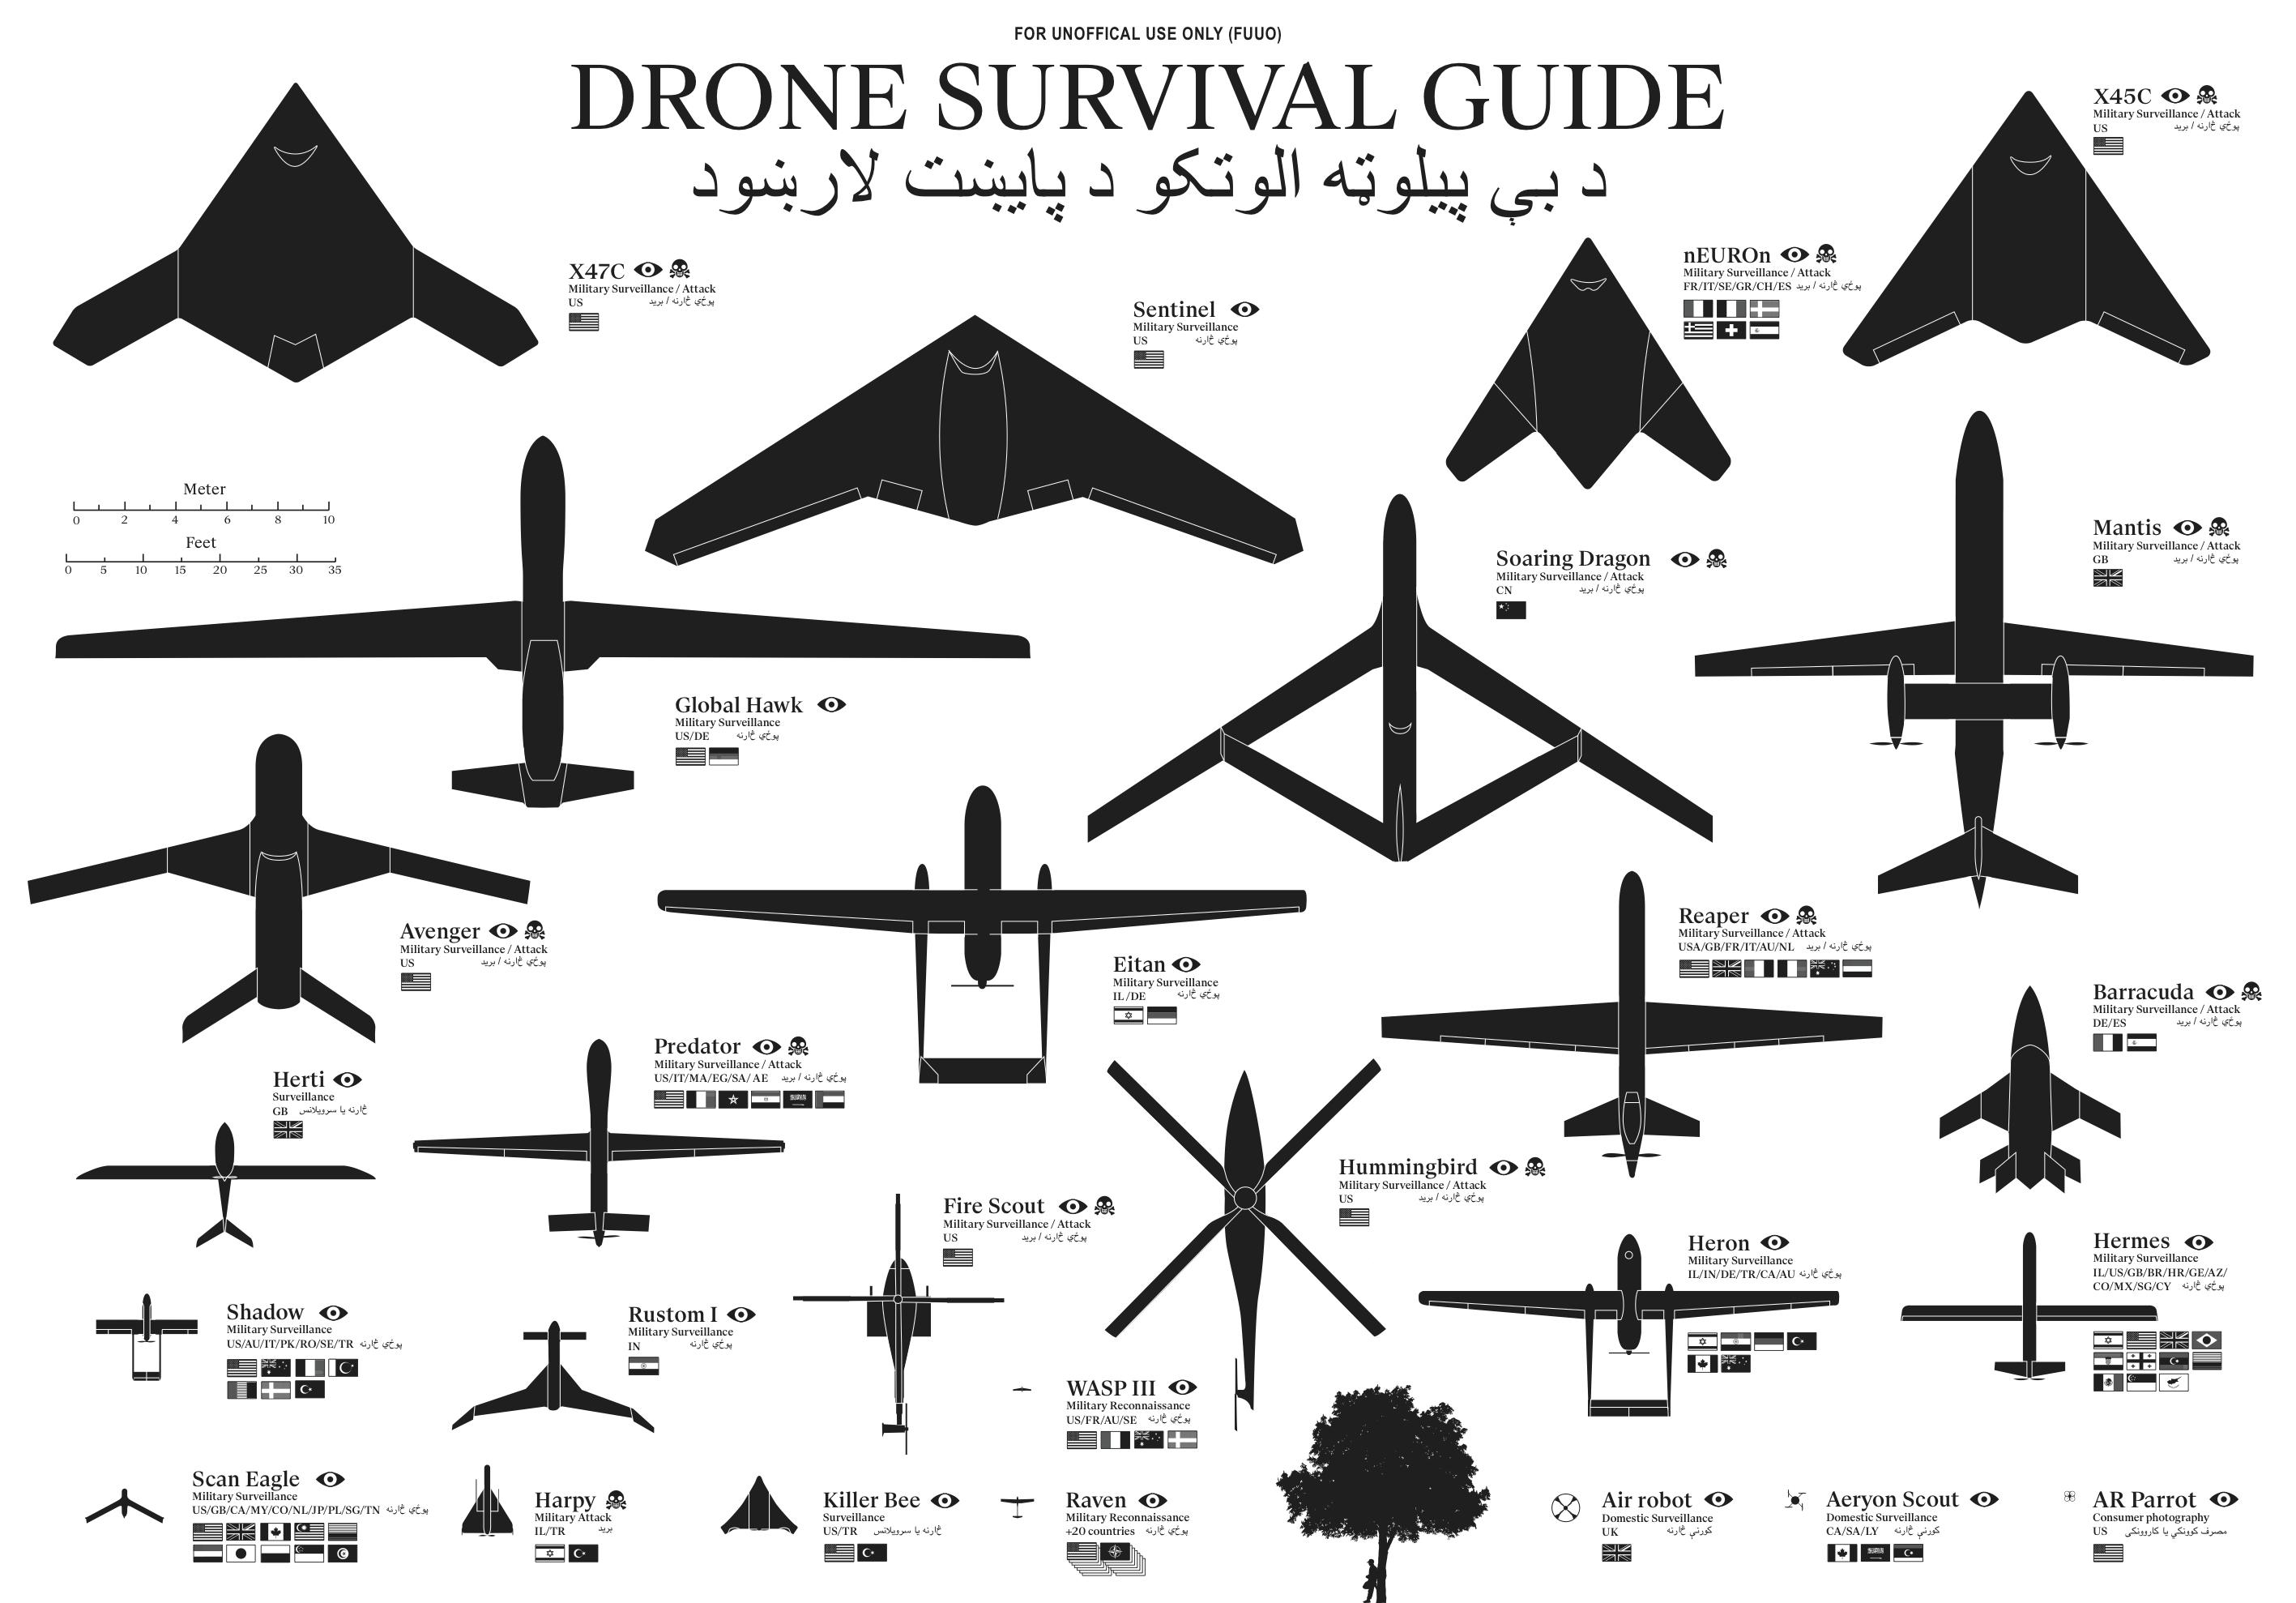
The Drone Survival Guide is a poster and online infographic that uses proportionally sized silhouettes of the most common UAVs (Unmanned Aerial Vehicles).  Designed by Ruben Pater, a self-employed artist/graphic designer from the Netherlands, the poster is available for download as a PDF.

Posters printed on aluminum reflective Chromolux ALU-E mirrored paper are available from the site for €10, which included worldwide shipping.

TWENTY-FIRST CENTURY BIRDWATCHING

Our ancestors could spot natural predators from far by their silhouettes. Are we equally aware of the predators in the present-day? Drones are remote-controlled planes that can be used for anything from surveillance and deadly force, to rescue operations and scientific research. Most drones are used today by military powers for remote-controlled surveillance and attack, and their numbers are growing. The Federal Aviation Administration (FAA) predicted in 2012 that within 20 years there could be as many as 30.000 drones flying over U.S. Soil alone. As robotic birds will become commonplace in the near future, we should be prepared to identify them. This survival guide is an attempt to familiarise ourselves and future generations, with a changing technological environment.

This document contains the silhouettes of the most common drone species used today and in the near future. Each indicating nationality and whether they are used for surveillance only or for deadly force. All drones are drawn in scale for size indication. From the smallest consumer drones measuring less than 1 meter, up to the Global Hawk measuring 39,9 meter in length. 

Concept and design by Ruben Pater. Want to know more about the motivation behind this project? Read the FAQ.

The poster is also being publicized in conjunction with the Drone Salon seminar coming up on May 23, 2014.

The drone salon aims to provide a multidisciplinary overview of challenges, opportunities and speculations on future transitions caused by the use of drone technology both in the battlefield and in the civic realm. This seminar, punctuated by demonstrations and presentations, will consist of five conversations between Malkit Shoshan, Ethel Baraona Pohl and experts in the field: lawyers, activists, civic and military drone operators, artists, novelists and designers. The conversations will bring together multiple views, examples and projects on the spatial effects of the implementation of drones in war and in peace time. The seminar is part of the ‘Drones and Honeycombs’ project and one of a series of public events on the topic of drones organised in collaboration with Studio-X, Columbia University, DPR-Barcelona, The Center for the study of the Drone in NYC and Het Nieuwe Instituut in Rotterdam.

The design is actually very similar to the SciFi Starship Comparison Chart, but on a much smaller scale.  Many people in Ruben’s audience have sent in translations for the text included in the poster, so he has posted the text in at least 32 different languages.  I would like to see those translations offered as full versions of the poster, instead of the text only, but I understand that takes a lot of work.

I’m fascinated by drones, and I own and fly one of the AR Parrot Drones you see in the bottom right corner of the poster.

Thanks to Ethel Baraona Pohl for posting on Facebook!


Wednesday
May072014

The Dead Zones: When Not to Post on Social Media

The Dead Zones: When Not to Post on Social Media infographic


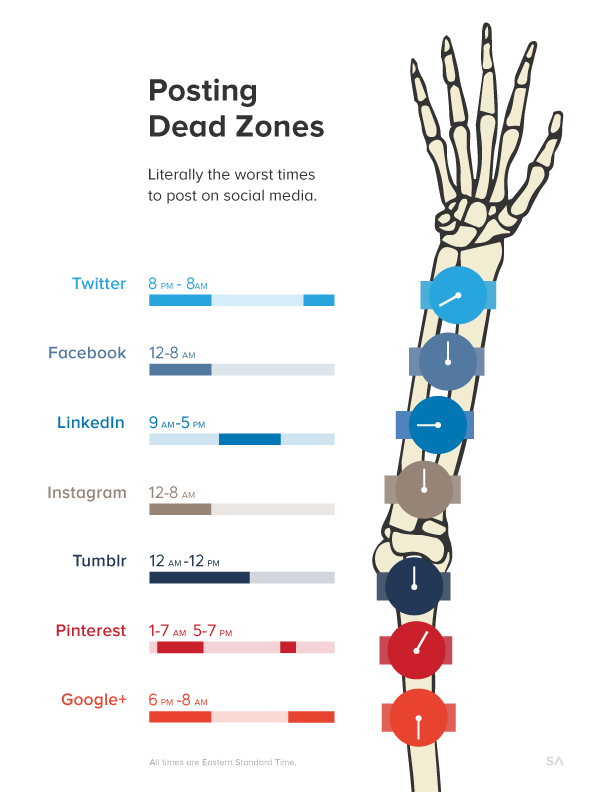
The Dead Zones: When Not to Post on Social Media infographic from SumAll takes a look at the the worst times to post content on social media.

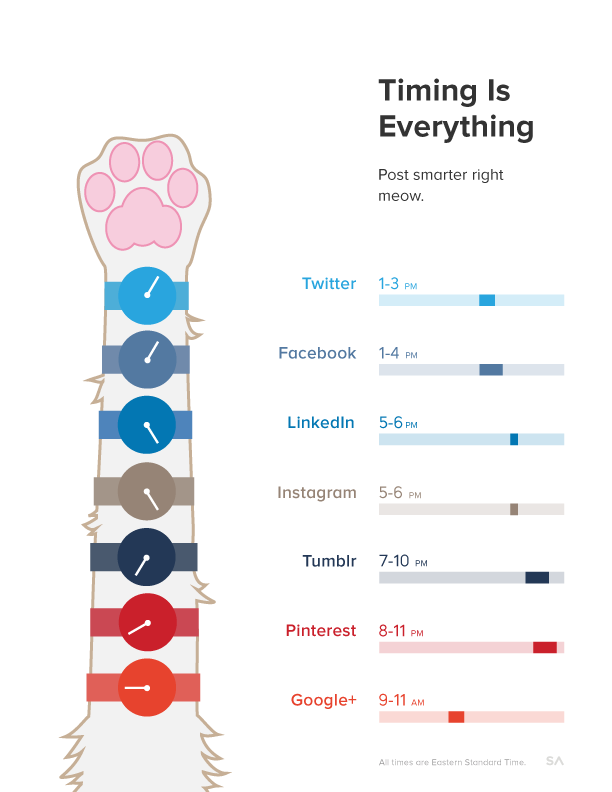
Now that everyone knows the best times to post on social media – and if you don’t, take a look at our infographic for a refresher–we started thinking about the flip side to the golden hours: the dead zones.

We researched what hours of the day your post will be seen by the fewest number of people and collected them all into this infographic. Beware.

Tell one story really well is one of the keys to a successful infographic, and this design does just that!

Here’s their prior infographic about the BEST times to post for comparison:

BEST times to post on social media infographic


Tuesday
May062014

An Illustrated Guide to the Biggest Dragons

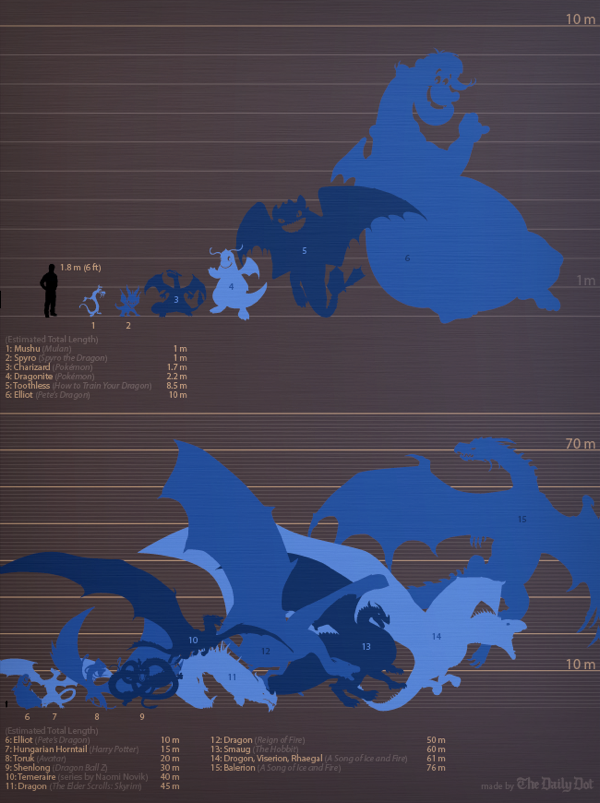
An Illustrated Guide to the Biggest Dragons infographic

A fantastic size comparison chart, An Illustrated Guide to the Biggest Dragons infographic was published by The Daily Dot, and designed by Max Fleishman and Fernando Alfonso III.

George R.R. Martin, whose A Song of Ice and Fire novels are the basis for Game of Thrones, is currently writing a companion guide to the books, called A World of Ice and Fire. He’s recently published an extract of this guide on his blog, chronicling the history of the Targaryen invasion of Westeros, which took place several hundred years before the events of the books and the show. 

It’s got some badass dragon art, too. You can see Aegon the Conqueror standing astride his dragon mount, Balerion, the “Black Dread.” Turns out these dragons get really freaking big.

But seeing this picture got us thinking. Just how big is this dragon, and how does this bode for Daenerys’s own dragons? And how does it measure up to other famous fictional fire-breathers?

A great data visualization, but it’s missing some elements of a good sharable infographic.  Where it comes up short is that the infographic will be often shared without the rest of the text article originally published on The Daily Dot.  It needs to be able to stand independently, so the infographic image file itself should include the following:

  • A title
  • A short description of information included
  • Credit the designers
  • The URL back to the original article
  • Data sources?
  • A copyright?

I love that they also published a revised version that fits in vertical blog layouts better:

An Illustrated Guide to the Biggest Dragons vertical infographic

Found on Geekologie and Flowing Data