About
Randy Krum
President of InfoNewt.
Data Visualization and Infographic Design

Infographic Design

Infographics Design | Presentations
Consulting | Data Visualizations

DFW DataViz Meetup

Join the DFW Data Visualization and Infographics Meetup Group if you're in the Dallas/Fort Worth area!

Search the Cool Infographics site

Custom Search

Subscriptions:


Feedburner

The Cool Infographics® Gallery:

How to add the
Cool Infographics button to your:

Cool Infographics iOS icon

- iPhone
- iPad
- iPod Touch


Read on Flipboard for iPad and iPhone

Featured in the Tech & Science category

Flipboard icon

Twitter Feed
From the Bookstore

Caffeine Poster

The Caffeine Poster infographic

Entries in comparison (73)

Monday
May132013

Is Elon Musk The Real Life Tony Stark?

Is Elon Musk The Real Life Tony Stark? infographic

With the new Iron Man movie in theaters, everyone has Tony Stark on the mind. But have you noticed the scary similarities between the fictional character and Elon Musk? The Is Elon Musk The Real Life Tony Stark? infographic from vcars.co.uk gives us the breakdown on each guy and then summarizes the similarities and differences.

Definitely a fun design.  I wish they had visualized any of the data for easier comparison, like height and net worth.

Thanks to Meilen for sending in the link!

Thursday
Apr182013

Star Wars vs. Star Trek

Star Wars vs Star Trek infographic

Which one wins, Star Wars or Star Trek? This is one of the most heavily debated question of all time. The Star Wars vs Star Trek infographic from hark.com and TrekNews.net will not give you the answer on who is better… However, it will give you some concrete numbers on things like awards, social media followers, number of video games, and movies.

The war wages on. The battle between two of sci-fi’s most iconic franchises, Star Trek and Star Wars, is a battle that has been discussed by fans for over 30 years. The recent news of J.J. Abrams accepting the director’s job on the next Star Wars film, only fanned the flames.

Today’s infographic pits the two franchises against each other once again — with criteria including number of films, box office gross, number of Academy, Grammy and Emmy Awards, video games, books, toys, and social media followers.

This is a fun topic, perfect to incite discussion and links from the online community.  My only criticism of the design is the many of the statistics are not visualized.  Big fonts are not visualizations, so the infographic would be easier to comprehend if numbers like the Total Box Office Gross proceeds were visualized.

Found on infographicjournal.com

Tuesday
Mar192013

Ink Costs More Than Human Blood

Ink Costs More Than Human Blood infographic

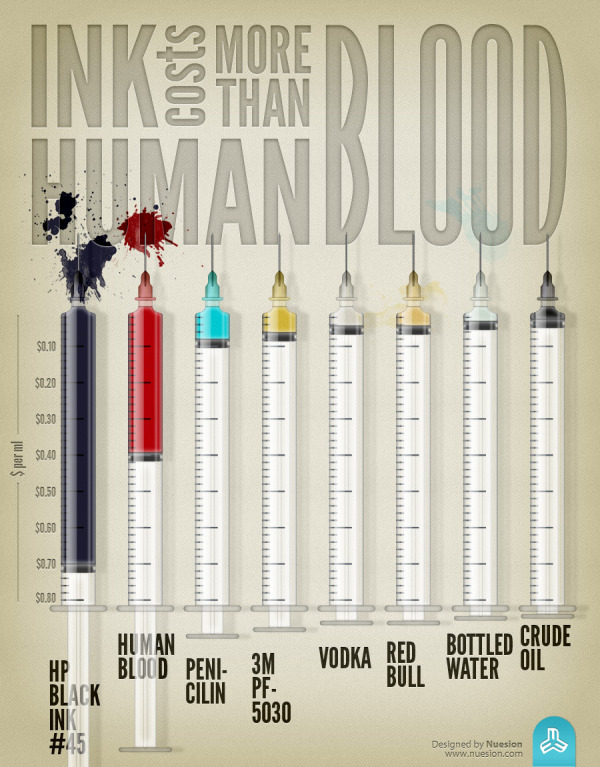
The Ink Costs More Than Human Blood infographic is a demonstration design by the team at Nuesion.

I think this is a fantastic design, but lacks some crucial elements for a successful infographic.  The overall design is telling one story very clearly, and that’s one of the best practices in infographic design.  Some of the best infographics have one Key Message that the audience can’t miss, and this design nails it!

The problem I see with this design is that it lacks credibility.  There are no sources listed, so the audience doesn’t know where the data came from or how current it is.  Why should they believe the data visualization?  Is it biased or skewed in any way?  Without doing a ton of research on their own, the audience has no way to tell.

Also, the footer of the design is missing both copyright information and a URL to the infographic landing page.  It lists the nuesion.com home page, but it took some digging on my part to find the original high-resolution infographic buried in one of their blog posts.

Tuesday
Mar192013

Serif vs. Sans: The Final Battle

Serif vs. Sans: The Final Battle

Ever have a problem deciding whether to use Serif or Sans? The Serif vs. Sans: The Final Battle infographic from webdesignerdepot.com has broken down when and why you should use each one. The final verdict? Serif is better for print and Sans is better for web.

First it was the Capulets versus the Montagues; then it was Coke versus Pepsi; and the latest epic battle? Serif versus sans-serif, of course.

Lucky for us, the crew at UrbanFonts has produced a nifty infographic to help clarify the age-old rivalry between serif and sans. Brief, yet information-packed, it covers everything from DPI to classification, and expertly explains why serif is better for print and sans serif is best suited for web.

This clever infographic — that smartly draws upon humor to drive home its points — offers a simple, insightful conclusion that designers should bear in mind: “The best font choices are ones where readers do not notice the font … but the message.”

Thanks to Jordan from Say It Visually for sending in the link!

Wednesday
Jan022013

Comparing NFL Stadium Screens

Comparing NFL Stadium Screens infographic

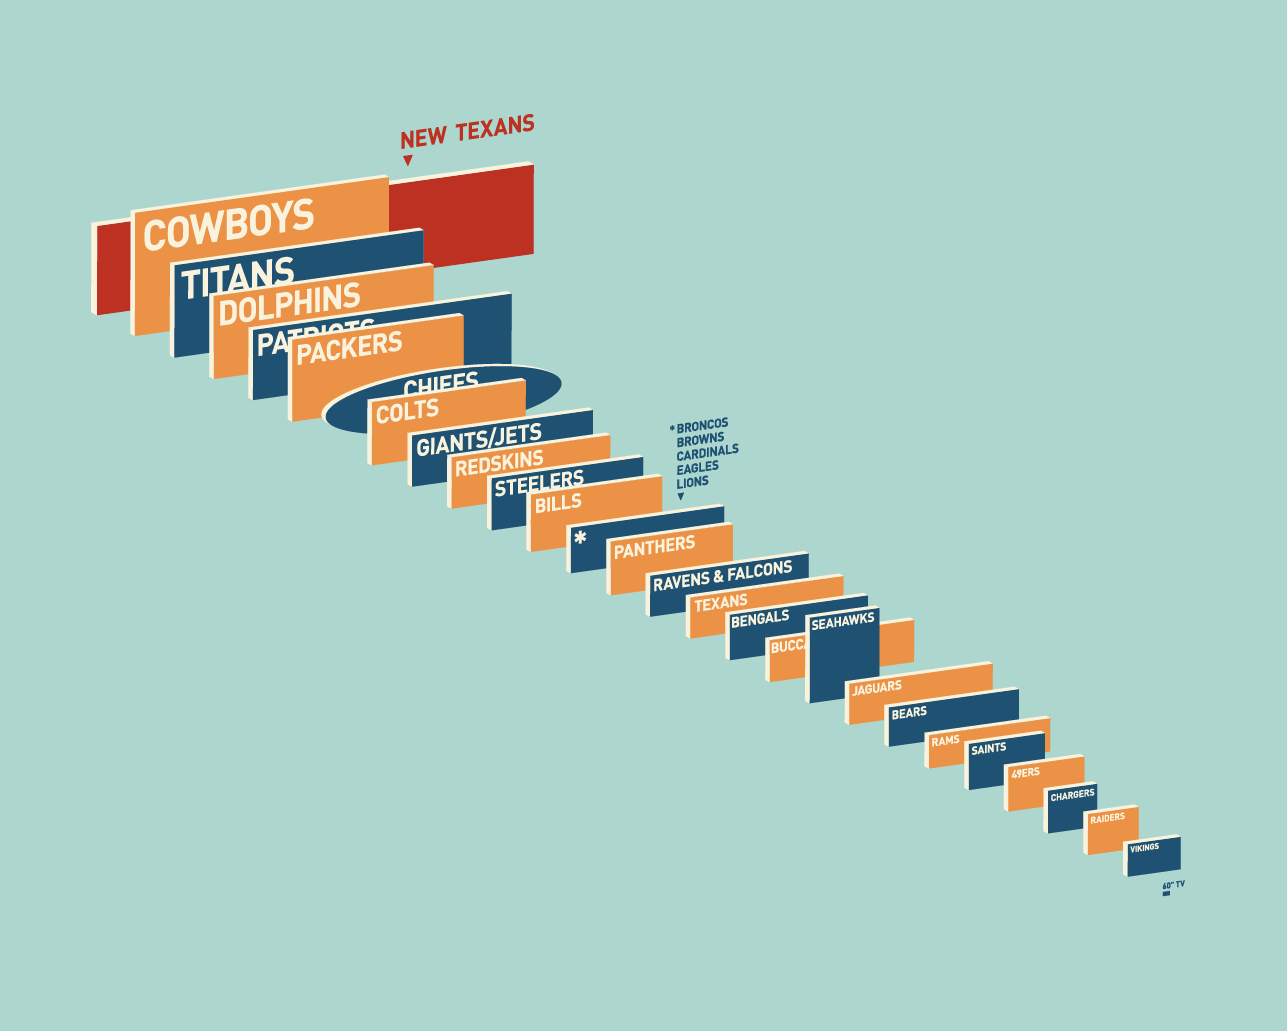
This visual comparison of NFL Video Screens was uploaded by reddit user dbeat after the announcement of the new video display being built for the Houston Texans’ Reliant Stadium.

I would have liked to see a link to the data behind all of the screen sizes, but this visual representation does a great job of telling one story really well.  The readers can easily find their favorite team, and understand how they stack up.

Found on FlowingData and Deadspin

Monday
Nov192012

The Difference Between the United Kingdom, Great Britain, and England

The Difference Between the United Kingdom, Great Britain, and England infographic

Do you know the Difference Between the United Kingdom, Great Britain, and England? This infographic from sa-la.jp spells out the differences. It also includes a timeline of major events and some ideas for the future.

The terminology of the UK is quite complicated, so it’s no wonder that people get confused. Are Great Britain, the UK and England the same thing? Is Ireland part of the UK? What’s Wales!? To help explain things, I put together this infographic to define the parts that make up the UK and how it came about. If you still have any questions by the end of it, feel free to ask in the comment section below.

Really good infographic design that uses different visualization methods in the visual explanation.  Maps, icons and a subway map style timeline are easy to understand, and give the reader a basic understanding of the UK.

The sources should be more specific, linking to specific web pages, and there should be a URL to the original infographic landing page in the footer.

Thanks to Tim for sending in the link!

Tuesday
Nov132012

Which Social Networks Take Home the Gold?

Which Social Networks Take Home the Gold? infographic

How popular is your favorite social network?  It is important to know if it is on the rise or decline because well, what is the use of a SOCIAL network with no one on it?  See which are on the rise and some interesting facts about who is on which social network with mashable.com’s Which Social Networks Take Home the Gold?

We love the Olympics, but an international social media showdown is a little more our speed.

Ignite Social Media is back with the 2012 Social Network Analysis Report, breaking down demographic, geographic and search data that shows which networks are the underdogs and which are mounting the winners’ podium.

Here at Mashable, we can’t get enough GIFs and hashtags. We’re excited to see that this type of digital currency is gaining value — Twitter and Tumblr are among the top five networks with the strongest rate of growth.PinterestReddit and LinkedIn round out the pack.

Launched just over a year ago, Google+ was included in the report for the first time this year but is notably absent from the list of fastest growing platforms. And while Facebook is actively continuing its quest for world domination, it’s hard to improve your growth rate when practically everyone’s already joined the club.

Check out the graphic below, with data based on a report from Ignite Social Media. It also features statistics about men versus women, the youngest skewing networks and which sites are luring in the whiz kids. The researchers at Ignite point out that social network search interest continues to remain stagnant, as it has since 2009.

The timeline trend charts are especially effective showing the rise (and fall) of many of the most popular and well-known networks.  Even though these are “simple bar charts”, they are incredibly effective in making the data easy to understand to the readers.  Although its explained in the footer, it would have been better to explain the  y-axis unit of measure along with the charts.

Found on mashable.com

Friday
Nov092012

Car Sizes Through the Years

Car Sizes Through the Years infographic

It has been a gradual change, however it is definitely there. Our cars have gotten bigger. Automotive.com walks us through some of our favorite car’s growth spurts in the Car Sizes Through the Years infographic.

One of the great joys of living in Los Angeles is the wide variety of cars you see on the road. It provides a great contrast, especially when comparing between generations.

For example: a while back, news director Keith Buglewicz was driving down the freeway when he found himself behind a 2013 Ford Mustang, and its 1967 fastback equivalent. The modern Mustang dwarfed its predecessor in every dimension; comparatively speaking, it was mammoth.

When did cars get so big?

I really like this design.  It’s very focused on telling one story about the growing size of cars, and the design style is superb.  By using images and outlines of the actual cars, it tells the story much better than a bar chart would have because the images are recognizable to the reader which improves comprehension.

The design is missing some form of copyright statement and the URL link to the original infographic landing page so readers can find the high-resolution version when they see this posted on other sites.

Thanks to Chris for sending in the link

Monday
Nov052012

Comparing Hurricane Disasters: Sandy vs. Katrina

Comparing Hurricane Disasters: Sandy vs. Katrina infographic


Comparing Disasters: Sandy vs. Katrina from The Huffington Post does a good job of clearly walking through the data to put the two mega-storm hurricanes into perspective.  Designed by Tim Wallace and Jaweed Kaleem

Over 100 people have died in the U.S. alone so far from Hurricane Sandy, and concerns are mounting that with hundreds of thousands still without power in frigid temperatures, the death toll will continue to climb. As the East Coast examines the destruction, comparisons have been made to other catastrophic storms.

Hurricane Katrina, which ravaged the Gulf Coast in 2005, killed over 1,800 people and cost nearly $125 billion. Both storms were deadly, destructive and devastating to the thousands who lost their homes and livelihoods. View the infographic below to see how they compare by the numbers.

Editor’s note: This infographic has been updated to to reflect new and more comprehensive data on the number of people displaced or who will potentially be displaced by Hurricane Sandy-related damage, including people in shelters and people who are not in shelters but have had to leave their homes.

This infographic design does a great job using simple data visualizations to compare the two hurricanes with visual styles that are quick and easy for the reader to understand.  I’m especially impressed with the effective use of the grid of squares visualization method.  Although normally used in blocks of 100 to show percentages, they are stacked in this design to show quantitative comparisons.  They correctly kept each row to only 10 squares, which many designers get wrong.  Our number system is base-10, so it’s incredibly easy for us to understand visuals that are stack of 10 objects.

I also appreciate that they varied the visuals to appropriately match the type of data being shown.  So, circles to show diameter, map locations to show areas effected and stacked bars are all used along with the grid of squares method.

The overall design has a white background, with no border, so when shown on a webpage that also has a white background, it’s hard to see where the infographic stops.  I usually recommend some type of background color or frame to help the infographic stand out on its own.

At the bottom, a couple elements are missing.  A Copyright or Creative Commons claim, and the URL for readers to find the original, full-size version when they see the infographic shared on other sites.

Wednesday
Oct032012

How-Many Guide to Kitchen Conversions

Common Cook's How-Many Guide to Kitchen Conversions infographic


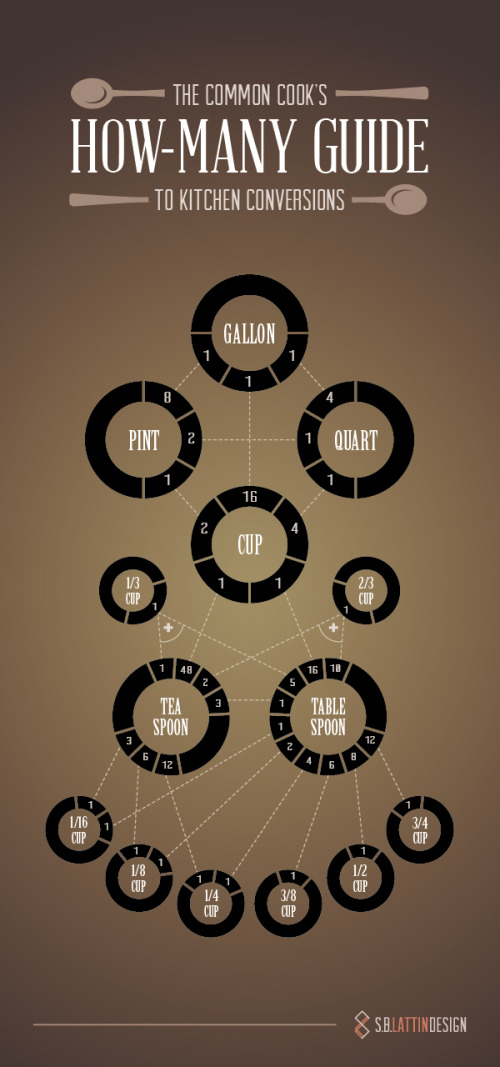
Designed by Shannon Lattin at S.B. Lattin Design, the Common Cook's How-Many Guide to Kitchen Conversions is a super-helpful infographic design.  Very quickly the reader can lookup to the conversions between many of the most common recipe measurements.

If your kitchen drawers are anything like ours, you never have the right measuring implement for the recipe you’re tackling. Keep this chart on hand, and the next time you find yourself asking “How many…” you’ll know just what to do.

This design is an excellent example of "tell one story really well."  It's a clear and simple design that is quick and easy for the reader to understand.  

Found on Visual.ly

Nice job Shannon!

Page 1 ... 2 3 4 5 6 ... 8 Next 10 Entries »