About
Randy Krum
President of InfoNewt.
Data Visualization and Infographic Design

Infographic Design

Infographics Design | Presentations
Consulting | Data Visualizations

DFW DataViz Meetup

Join the DFW Data Visualization and Infographics Meetup Group if you're in the Dallas/Fort Worth area!

Search the Cool Infographics site

Custom Search

Subscriptions:


Feedburner

The Cool Infographics® Gallery:

How to add the
Cool Infographics button to your:

Cool Infographics iOS icon

- iPhone
- iPad
- iPod Touch


Read on Flipboard for iPad and iPhone

Featured in the Tech & Science category

Flipboard icon

Twitter Feed
From the Bookstore

Caffeine Poster

The Caffeine Poster infographic

Entries in comparison (73)

Friday
Jan202012

Geek vs. Nerd: Which Are You?


The Geeks vs. Nerds head-to-head smack-down comes to us from MastersInIT.org

In the ongoing battle between geek and nerd, one must take sides, but how can this be done without a solid argument for both personas? We here at Masters In IT (a mix of nerds and geeks) decided that it’s time to lay all the cards on the table to determine which is better and answer the question some fear to know: Are you a geek, or a nerd?

A little text-heavy and lighter fare than I normally post, but this one is just fun to read through.  There are a handful of stats included, and the doughnut charts and bar charts are easy to understand.

Like many of the infographics I’ve posted lately, it’s missing a URL at the bottom for readers to find the original post, a copyright statement and listing the designer!

Thanks to Gerri for sending in the link!  Also found on Infographic Journal, Daily Infographic.

Monday
Jan162012

Learning to Love Tennis

Learning to Love Tennis is a cool infographic describing the major changes within the USTA’s rules for kids playing tennis.  Designed by Digital Surgeons, the infographic visualizes some the biggest changes like court sizes, raquet sizes and net height.  Also, including things like comparing the calorie burn of different sports help show the reader why tennis is such a great sport for kids.

The game of tennis has been scaled for youth play.  To date, tennis has been the only major sport without equipment and field of play dimensions specific to children.  By introducing smaller and lighter racquets, balls with different compression ratios, lower nets and scaled court sizes, kids can begin playing and competing earlier.  Earlier participation and play increases engagement and reduces frustration associated with using adult-sized racquets that kids find clunky and heavy, or court sizes that are simply too large for children to effectively navigate.  Far too many of our country’s youth are huddled around the TV or tethered to a video game controller.  These new rules provide the means to get kids off the couch and engage in an activity that they can continue for life.

Overall, I really like this design.  The style is eye-ctaching and information is laid out in an easy-to-read manner.  I like most of the visuals, and there are only a couple things I would change:

  • The grid of 30 kid icons showing 70% of Kids Quit Sports isn’t accurate.  The visual is 22/30 kids , which is 73.3%  This type of visual always works better as a grid of 100.  Don’t make your readers count icons to figure out what you’re showing them.  Rows of 6 are just odd, and tought to understand.
  • One of the biggest differences is the new balls used by different ages.  It would have been nice to visualize the difference in bounce for each ball to help the reader understand.
  • The Average Height, Stride Comparison and Average Weight is lost in the design, because it’s all text.  In an infographic that makes it less important and the reader just skips over that section.
  • At the bottom should be the URL to the official landing page so readers can find the original infographic.

This is a really huge initialative for the USTA, and the new rules are complicated to understand for parents.  An infographic is a fantastic way to simplify their message, and I think this will help them out a lot.

Thanks to Pete for sending in the link!

Friday
Sep232011

The Blog Tree: New Growth infographic and Q&A


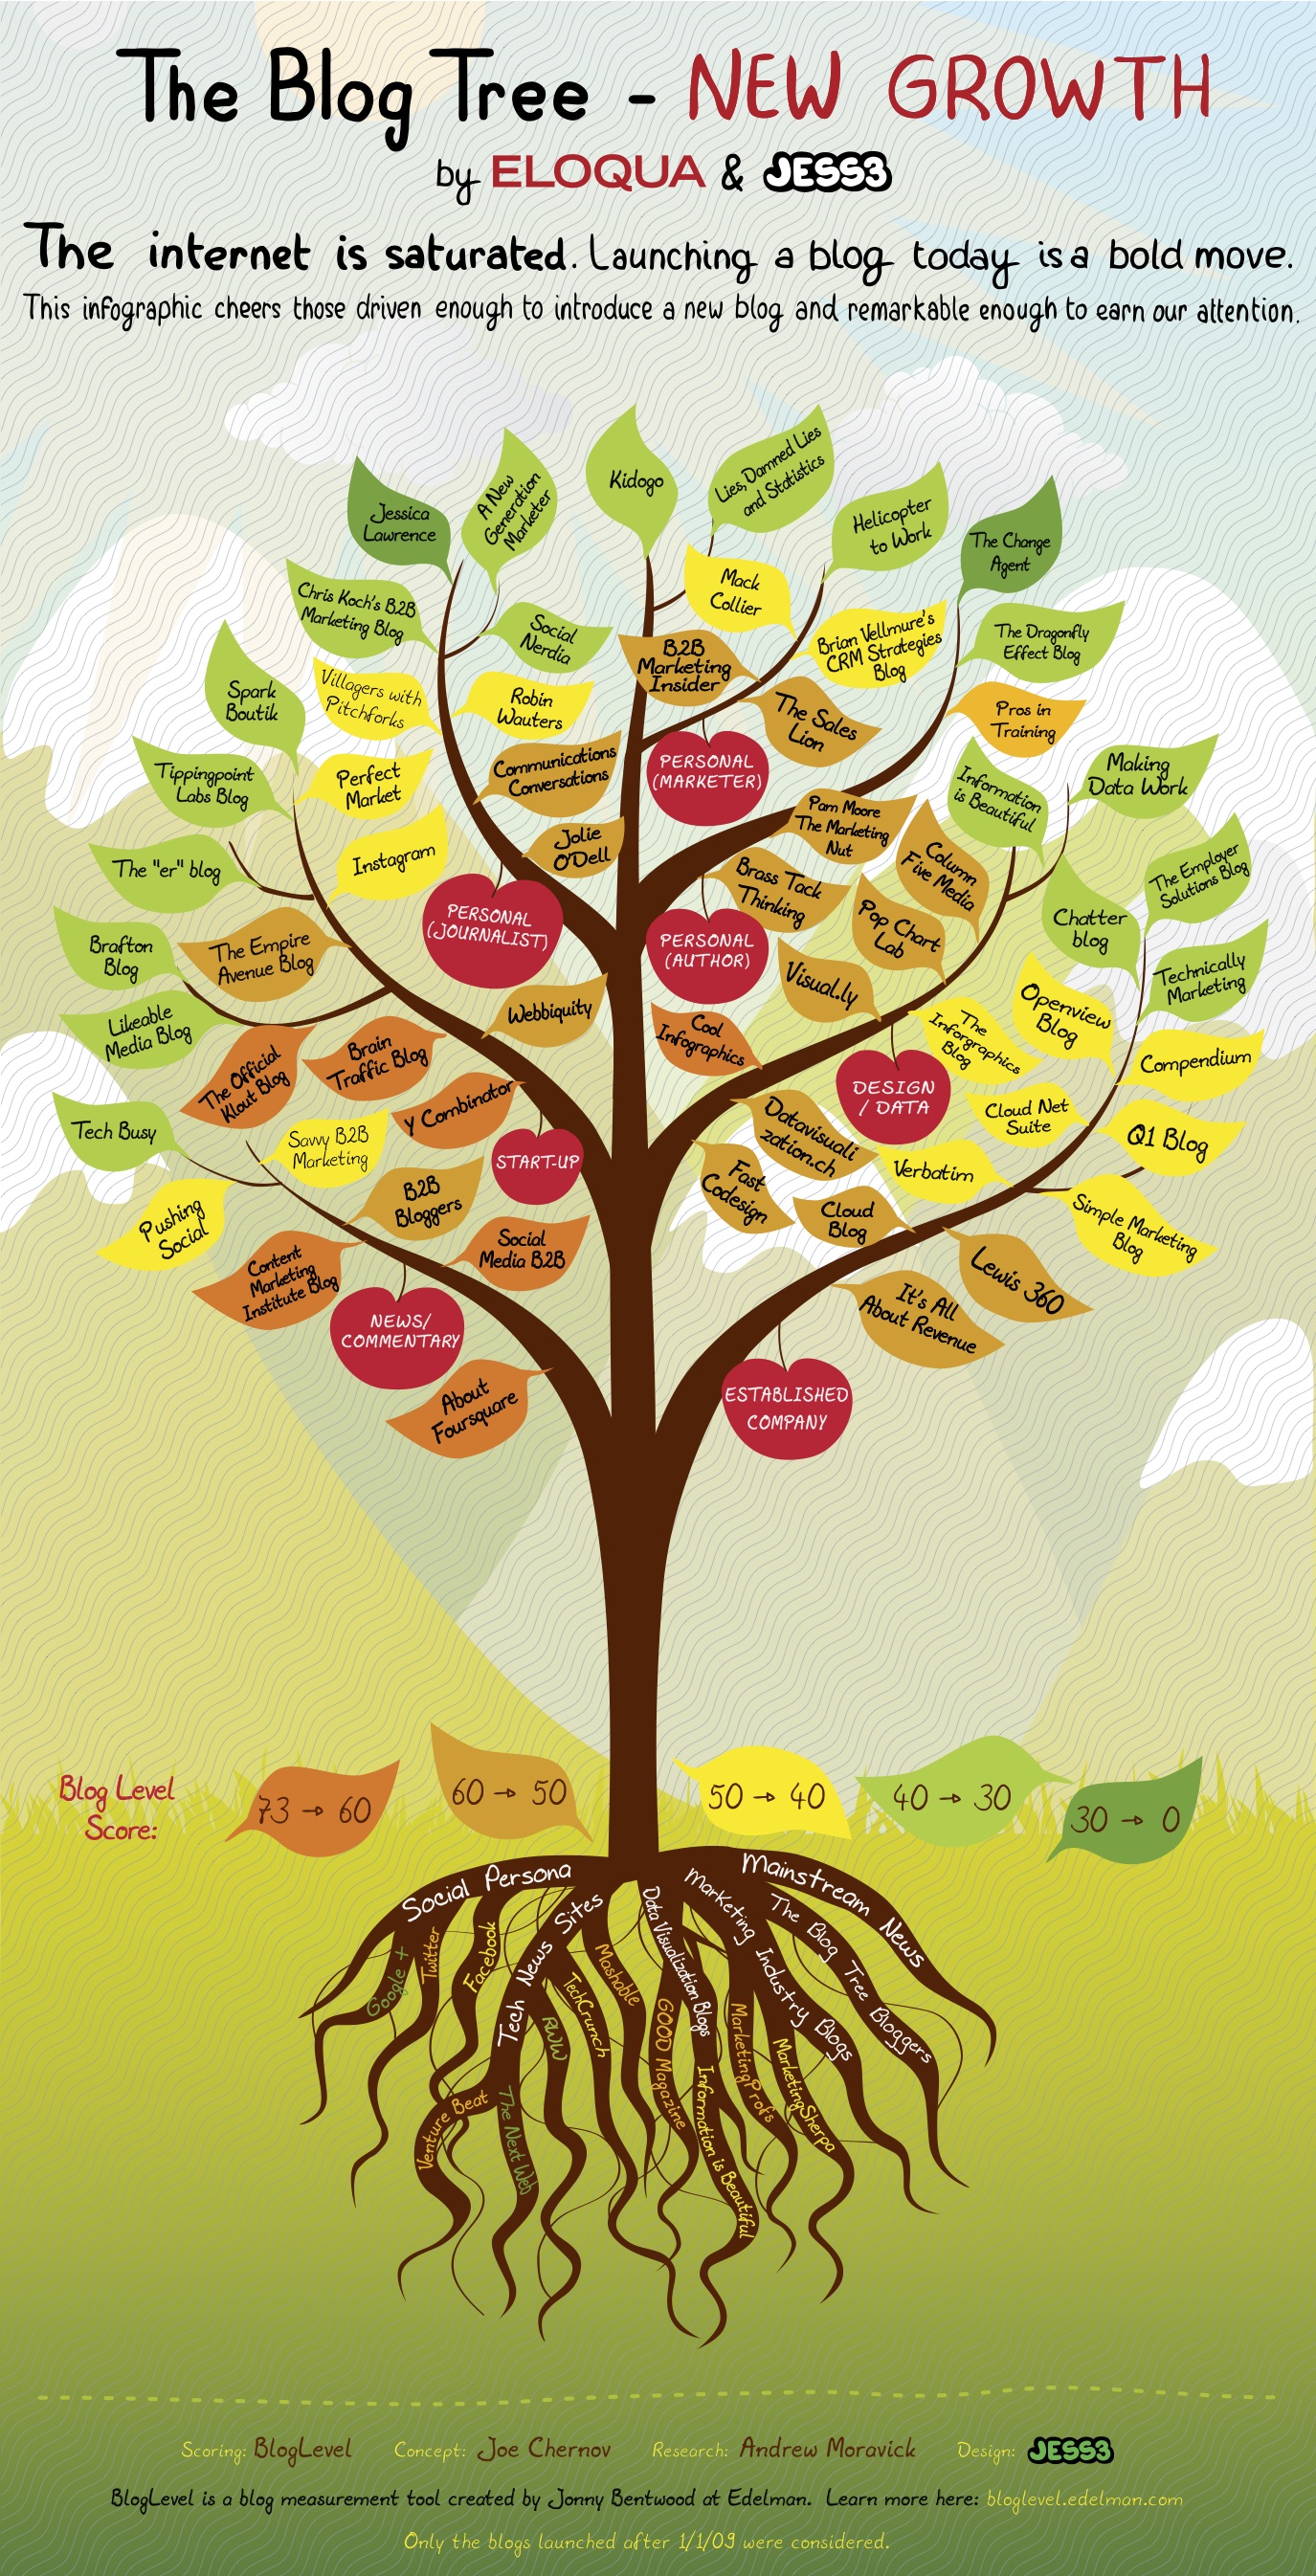
Eloqua and JESS3 have partnered again to design The Blog Tree: New Growth (building on the success of the original Blog Tree infographic project from last year).  The new version focuses on new blogs from the last few years (INCLUDING Cool Infographics!) and uses the Edelman BlogLevel as the scoring system (a ranking system I hadn’t heard of before). They are also using SlideShare.net as an embedded PDF viewer so you can interact with the clickable version that takes you to any of the blogs by clicking on any particular leaf.


The Blog Tree: New Growth
View more documents from Eloqua


A couple things worth mentioning about the project:

  • The clickable version is available on SlideShare.net or as a downloadable PDF file.
  • They are using Facebook photos in a unique way.  They are asking anyone interested in being a part of the next version to “Like” the Eloqua page and tag themselves in the image of this year’s Blog Tree.
  • They’ve added the concept of site badges this year for anyone listed on the tree.  From a content stance, this is a great way to encourage long-term links from influencial blogs.


From the Eloqua blog post:

We’re calling today’s visual is The Blog Tree: New Growth edition because it celebrates a very important group of bloggers. New ones.  All gene pools benefit from healthy DNA, and if the blogosphere is going to continue to evolve, it’s important that new voices are heard. The Blog Tree: New Growth cheers about 60 active, insightful blogs launched (or significantly re-engineered) after January 1, 2009.  It’s truly a collection of the freshest voices on the Web.

After combing through the feedback we received on the original Blog Tree, we made two significant changes in this version:

  1. Interactivity: Today’s infographic is interactive. Every leaf links to the corresponding blog. Interactivity was a popular request in the wake of last year’s visual, and when we shared a draft with the bloggers featured on the New Growth version, they too asked for it. The result is an infographic that fulfills its promise of making it easier for you to discover blogs we think you’ll love.

  2. (Much) Better Ranking System: Last year’s version looked only at Web traffic, and we received a bit of pushback on that ranking model. So we turned to one of the world’s most reliable sources of trust and influence: Edelman. We used Edelman’s BlogLevel tool as our sole data supplier because it gave us the most holistic view of each blog’s relative influence, popularity, engagement and trustworthiness.


I asked Joe Chernov, VP of Content Marketing at Eloqua, a few questions about the project:

Cool Infographics: You’ve partnered with JESS3 on a number of infographic projects now.  What do you see as the biggest benefit of designing infographics as online content?

Joe Chernov: Marketing today is all about having strong “fast twitch” muscles. It’s about creating content, lots and in rapid succession, that appeals to viewers with short attention spans. It’s a hell of a challenge, especially for a business-to-business technology company, like Eloqua, whose story typically takes a little longer to tell. The benefit of an infographic is that it’s like a Trojan Horse: The visual captures attention, giving the marketer time to convey a message.

Cool Infographics: What did you learn from the original Blog Tree that changed how this one was designed?

Joe Chernov: We learned what worked. It’s funny, in “post-mortem” meetings, companies often focus on what didn’t work. But it’s also important to inspect what did work. When we released the original Blog Tree, I hesitated. I thought people might accuse it of being too high concept or pandering. Neither accusation was made. My hope was that the public recognized that we put thought into the selection, that it was truly a meritocracy. So what we learned going into the New Growth edition is that the key to success was found in the quality of the curation. Sure there were some improvements that needed to be made at the margins. Using traffic as the sole metric was a ridiculous oversimplification — and one that was 100% my fault — and, as you pointed out insightfully, the leaves absolutely should link through to more content, preferably the blogs themselves. So we made those changes.

Cool Infographics: What would you tell companies considering infographics as part of their marketing strategy?

Joe Chernov: Respect the medium. Simply calling a bunch of Excel line graphs and bar charts an infographic doesn’t make it one. Stuff like this (http://blog.marketo.com/blog/2011/09/attention-b2b-marketers-embrace-the-mobile-web.html), I believe, damages the medium because it eliminates art and nuance, which are essential elements of a good infographic. Before we publish any infographic I ask myself, “What would David McCandless (http://www.davidmccandless.com/) say if he saw this? Would I be proud to show it to him?” Try to be an ambassador for the medium, because it’s under duress.

Cool Infographics: I had never heard of the Edelman BlogLevel before.  Why did you use that as your blog metric in the design?

Joe Chernov: We needed a better metric than the simple traffic data that we used to grade blogs in the original Blog Tree. Not only was that metric one-dimensional, it was also a poor measure of the quality of a new blog, which we were trying to highlight in the New Growth version we just released. After all, it takes a while to build up traffic to a blog. So we looked for a multidimensional blog “grader” from a trusted, independent source. Edelman and trust are synonymous, at least in the communications world. And their BlogLevel tool evaluates much more than traffic. It looks at engagement and the soft science of trust. I have also collaborated with David Armano, one of Edelman Digital’s leaders, in the past so I welcomed the chance to partner with him again.

Cool Infographics: In your opinion, why do blogs continue to be relevant online?

Joe Chernov: Because this is the era of transparency. Buyers want to know, really know, who they are doing business with. The blog, or at least should be, a window into the organization.


Also, check out Joe’s presentation about infographics that he gave at this year’s Content Marketing World conference, and available on SlideShare:


Infographics in 15 Minutes
View more presentations from Eloqua
Monday
Aug292011

Students vs. Prisoners infographic


Nice, clean, simple infographic design.  Students vs. Prisoners by the law firm Buckfire & Buckfire in Michigan visually communicates one message really well: In Michigan, the average spending per prisoner is close to three times that spent per student.

Potentially a controversal budget topic in Michigan, I appreaciate that they clearly listed the link to the data source.  A couple things I would change about this design:

  • Visualize the total spending dollars that are currently listed at the the bottom in text
  • I like the use of a chalkboard style font, but it’s not used consistently throughout the design
  • For the benefits listed in the middle, I think it would be more interesting to show how much each one contributed to the total spending per prisoner

Thanks to Larry for sending me the link!

Friday
Jul012011

Client Infographic: Waste in the Texas Energy Market

Waste in the Texas Energy Market from ChooseEnergy.com is a new infographic by InfoNewt and designer Jeremy Yingling.  This one tells the story of how much money is NOT being saved by households that don’t take advantage of lower pricing since Texas has a deregulated electricity market.

As the economy struggles to recover and households continue to cut back on spending, one of the easiest ways to save money might just be in your electric bill. In these tough economic times, consumers realize the importance of watching how every penny is spent. Today we look at the “Waste in the Texas Energy Market” and how pennies can certainly add up quickly to improve consumer finances.

Following the Infographic Release Strategy from InfoNewt, ChooseEnergy also did a great job setting up a dedicated landing page and custom URL for the infographic.  All of their links then drive traffic to this single page.  So the company blog post, Twitter feed and Facebook posts provide additional descriptions and links to this landing page.

While highlighting the fact that the Texas energy market is the 11th largest in the world, the infographic also shows that 48% of the electricity consumed is from residential use.  So what’s the big deal?  On average Texas residents pay about 11.5 cents per kWh for their home electric use when they could be paying 8.5 cents per kWh.   Doesn’t sound like much does it?  Well, those 3 pennies can add up fast and they add up to $3.7 billion for the Texas consumer market.

You can follow ChooseEnergy on Twitter at @texas_electric

Tuesday
May242011

U.S. Education vs. The World

U.S. Education vs. The World is a very cool infographic from MAT@USC.  You can imagine this data as a boring series of bar charts in an academic report, but the colorful, visual design here is fantastic.  The winding connecting lines can make it a little difficult for the reader to understand the data, but I think it also draws the reader in like a simple puzzle.

We’ve put together this infographic that compares the United States’ education spend and performance versus eleven countries.  The U.S. is the clear leader in total annual spending, but ranks 9th in Science performance and 10th in Math.

Thanks to Sarah for sending in the link!

Monday
May022011

The Real Cost of Dating

This is a pretty simple one, but I appreciate when companies are willing to experiment with infographics and even design their own.  The Real Cost of Dating is from Match.com and based on a survey they performed in March of 2011.  So here, the company is putting their own, proprietary data out on the web to inform readers and draw them into the match.com blog.

First, I like the talk bubble used as a pie chart.  It really helps reinforce the data as “Men say…”, “Women say…”.  Although I think the design is too subtle.  It took me a minute to even see that there were too colors in the bubbles.

Persoanlly, I think this design is very text-heavy, and much of the text is redundant.  For example, each statistic includes the text “…of women” when they are already in a section of the infographic of just statistics from women.

Overall, good first swing at using infographics in your marketing strategy, and I hope they do more.

Thanks to Colin for sending in the link!

Friday
Apr292011

Regular vs. Royal Wedding Costs

Adaptu brings us the Regular vs. Royal: The Cost of Getting Married infographic.

Roses or tulips? Open bar or cash bar? New gown or alter the one you found online? Do you have room to invite former Prime Minister Tony Blair? The only task more stressful than planning a wedding is financing it, and nothing tops a Royal ceremony.

Keeping the cost in perspective, we wanted to compare the average American wedding budget to the Royal wedding between Prince William and Kate Middleton.

Click on the infographic to learn what the typical couple spends on flowers and ponder what botanical masterpiece cost the Royals $800k.

I was inundated with submissions of royal wedding infographics, and sadly only a few of them were good.  I like the fresh design aspect of this one designed by the team at Periscopic.com (I just added them to the Cool Links page).  The increasing size of the trapezoids stacked into a triangle is interesting.  What I can’t tell by observation is if they did the area calculations correctly.

In a visual comparison of shape sizes used to compare numbers in a data visualization, the area of the shapes is what the reader sees as indicative of the value, and in this infographic, but the width and height of each trapezoid is adjusted to maintain the traingle shape and be true to the values represented.

I applaud the effort to try new shapes and experiment with a fresh way to visualize the comparison between values.

Thanks to Dino for sending in the link!

Thursday
Apr282011

Self-Described Mac vs. PC People infographic

Profile of a Self-Described Mac Person vs. PC Person is a fun infographic looking at personality and preference differences.  Based on 388,315 survey respondents from Hunch.com, it illustrates topics like who throws parties, math aptitude, taste in art, cocktail drinks of choice and would they ride a Vespa or a Harley.

Our latest data project was to analyze how self-described Mac and PC people are different. The infographic below, designed by the talented folks at Column Five Media, breaks it down.

Back in ye olden days of Hunch — November 2009 — we explored the differences in personality, aesthetic tastes, and media preferences between Mac and PC users. Since then, the Hunch user base and question pool have grown many times over. The 2009 report started with more than 76,000 responses to its base “Mac or PC?” question. The same question now has nearly 400,000 responses. This is all in the context of the more than 80 million “Teach Hunch About You” questions which have been answered on Hunch to date.

From a research standpoint, even though the number of respondents is high, these are voluntary survey participants that haven’t gone through a screening process.  So while the results are fun, I don’t think they can be considered a statistically accurate representation of the population as a whole.

Very funny, and a great job by the design team at Column Five Media!  Found on FlowingData and Visual News

Monday
Mar072011

Comparing Apples to Oranges #infographic


Apples versus Oranges.


Designer Jess Bachman, in partnership with Smarter.org, has accomplished the seemingly impossible.  It’s common knowledge that comparing Apples to Oranges is so hard, it just isn’t done.  I’m thinking there’s a Nobel prize candidate here…  ;)

I’ve done it!  Apples to Oranges.  They say it shouldn’t be done, that it can’t be done.  But using the science and magic if infographics, I have done just that, compared apples to oranges.  The results are unsurprisingly surprising.  Little did I know that such botanical and culinary inequality existed in this modern age.  Prepare to be infographicalized.


Apples to Oranges.