About
Randy Krum
President of InfoNewt.
Data Visualization and Infographic Design

Infographic Design

Infographics Design | Presentations
Consulting | Data Visualizations

DFW DataViz Meetup

Join the DFW Data Visualization and Infographics Meetup Group if you're in the Dallas/Fort Worth area!

Search the Cool Infographics site

Custom Search

Subscriptions:


Feedburner

The Cool Infographics® Gallery:

How to add the
Cool Infographics button to your:

Cool Infographics iOS icon

- iPhone
- iPad
- iPod Touch


Read on Flipboard for iPad and iPhone

Featured in the Tech & Science category

Flipboard icon

Twitter Feed
From the Bookstore

Caffeine Poster

The Caffeine Poster infographic

Entries in comparison (73)

Tuesday
Sep042012

2011 Wisconsin Crash Calendar & Interview

2011 Wisconsin Crash Calendar infographic

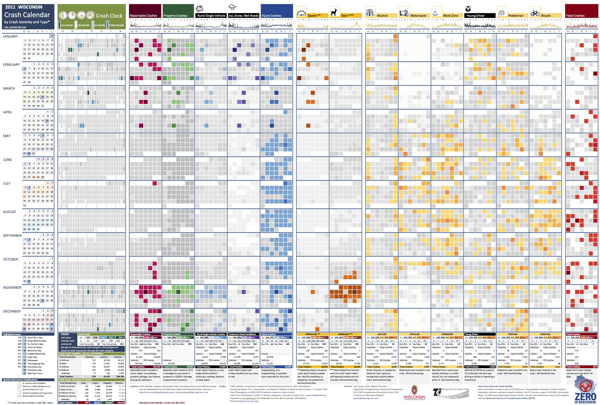
I love this infographic design!  Designed by Joni Graves, a Program Director at the University of Wisconsin-Madison Department of Engineering Professional Development (that’s a mouthful!).  I highly recommend downloading the PDF version and taking a closer look on your own.

The original version and a few variations are available on a couple different official sites:

The Wisconsin Bureau of Transportation Safety (BOTS) uses printed copies of the infographic calendar at meetings around the state with various groups to generate discussions about what causes crashes and how to interpret what the data shows.

This design is a great example of how visualizing the data allows the readers to see patterns in the data and much more easily understand the stories behind the data.  The color coding makes it easy to compare the data subsets, and the consistent layout to match a traditional paper calendar is very easy to follow.

There are so many findings you can quickly see in the big dataset.  Some are obvious, but many are surprising.  For example, you can clearly see…

  • Alcohol-related crashes happen primarily on weekends, and fairly consistently throughout the year.
  • Deer Season is clearly identified in Oct-Nov.
  • There was something special about July 1st…
  • Motorcycle, Work Zone and Bicycle crashes occur during the Summer months.
  • Ice, Snow, Wet Road crashes are highest in Jan-Feb, but what happened on April19th?  Late Winter storm?
  • Speed related crashes are primarily reported in the Winter months.
  • Fatal crashes are evenly spread throughout the year

Joni was also willing to answer some interview questions about this project and her design process:

Cool Infographics: What software applications did you use to create the Crash Calendar?

Joni Graves: EXCEL 2010 using Pivot Tables. Presentation advancements incorporate Microsoft’s PowerPivot using SharePoint.

Cool Infographics: Was the design created in cooperation with the Wisconsin Transportation Information Center, or was it an independent project? 

Joni Graves: I’m a Program Director at the UW-Madison Department of Engineering Professional Development and part of the WI LTAP (FHWA’s Local Transportation Assistance Program) / Wisconsin Transportation Information Center (TIC).

Cool Infographics: How long did the design take you to create?

Joni Graves: It’s a longer story, if you’re interested, but the skinny is that I started working on the Crash Calendar format in mid-April and previewed it at a meeting the end of the month. I had a learning curve with some of the intricacies, and spent about 200 hours on it during that two weeks! Since then it’s taken on a life of its own — and I am delighted by that!

Cool Infographics: Would you describe your design process?

Joni Graves: I would be happy to elaborate on this but, as an inveterate designer / tinkerer, I’ll confess that I’m always discovering some new way of formatting / displaying the data, and disappointed that there’s never enough time to do the new ideas justice …

Cool Infographics: What’s the most interesting thing you learned from the data?

Joni Graves: I’ve certainly enjoyed the design process! More importantly, it’s been incredibly satisfying to see people engage w/ the data using this intuitive representation, or to read their comments, because it’s apparent that it helps make the data far more accessible! And I have loved the comments / responses.

Cool Infographics: What was the hardest part behind designing the Crash Calendar?

Joni Graves: As I noted, there’s been a fascinating learning curve. But the hardest part has been stopping! As noted above, I’m always trying to “improve” it — and always running out of time.

Cool Infographics: What should we expect from future versions of the design?

Joni Graves: We currently have a multi-year version, a web-demo site, and a working 2012 version. I’m very excited about incorporating choropleth maps. Although it’s a very interesting “historic” document, the real goal is to provide a resource that is far more timely and potentially predictive for local users. 

I’m really excited about our plans to webize it, because the real idea is to expand it as a national project — using multi-year FARS data, WI data, and data from other interested states — and we really want to “unleash” it for others to actively use. 

Cool Infographics: Challenges?

Joni Graves: There’s been a wonderful response — and we are trying to figure out how to actually fund an expanded project w/ enhancements!

One additional thing to note was that Joni was inspired to create the whole design project by Nathan Yau’s post on Vehicles involved in fatal crashes in 2010 (which I posted about here earlier this year), and I think she has done a great job building Nathan’s initial visualization into some something much more powerful and effective.

Thanks to Joni for sharing!

Thursday
Aug232012

The Rising Cost of Higher Education

The Rising Cost of Higher Education infographic

The Rising Cost of Higher Education from SchoolTutoring Academy does a good job visually showing the reader how quickly the price of college educations have risen.

Attending a college or university represents a significant investment for families. Tuition fees have continued to rise which has made it increasingly difficult for families to accurately budget and save. This problem is exacerbated for low and middle-income families where tuition fees as a percentage of median family income has increased significantly. Learn how affordable tutoring can help your child.

The design gets to the point immediately.  If the reader only looks at the top portion of the infographic (without scrolling down) they still walk away understanding the key message of how dramatically college costs have risen as a percentage of the median family income.  However, I don’t see any indication that the values have been adjusted for inflation or not.

I also like the concentric doughnut graphs that are used with consistent colors to show the same 8-year comparison for different income level families.  The line chart comparison of annual costs is also clear and easy to understand.

The lower portion of the design becomes too text heavy, and begins to show data values in text without visualizing them.  This is where the design will start to lose readers by trying to convey too much text information.  What is the icon in the description of Private Loans?

The bottom of the design is missing a copyright (or Creative Commons) license and should also include the URL to the infographic landing page where readers can find the original, high-resolution version.

Thursday
Aug092012

The Greatest Human and Digital Viruses of All Time

 The Greatest Human and Digital Viruses of All Time infographic

Viruses. We all hate them. If they aren’t slowings us down physically, they are slowing down our computers. See the best of the worst on uniblue’s The Greatest Viruses of All Time infographic from Uniblue’s free resource libraries site liutilities.com.

“If you think you are too small to make a difference, try sleeping with a mosquito.” โ€• Dalai Lama XIV

Viruses are inevitably small in nature, yet engineered to unleash intense and often terrifying devastation. They leave a costly aftermath whether it’s the irreparable loss of human life, or millions (sometimes billions) of dollars in lost revenue and property.

We have gone through history to find the worst viruses of them all; little creatures and scripts that have taken advantage of social and economic situations to propagate and amplify their prowess in mayhem and destruction.

Join us in this brief journey through time, spanning back as early as 1348 where we shall meet the darkest and most wicked viruses to ever afflict mankind.

This is a really elegant design that does a fantastic job of telling a story and walking the reader through the information.

Mostly text and illustrations, there aren’t many numerical data point to visualize.  The few numbers there are to work with, could have been visualized better to give them context and help the readers understand them better.  Why are 21 human icons shown to represent “75,000,000 to 200,000,000 dead” from the Black Death plague?

At the bottom should be some type of copyright (or Creative Commons) statement, and the URL for readers to find the original infographic landing page.

Designed by Derek Fenech, thanks for sending in the link!

Thursday
Aug022012

Find the Best Airline Fees

Find the Best Airline Fees infographic

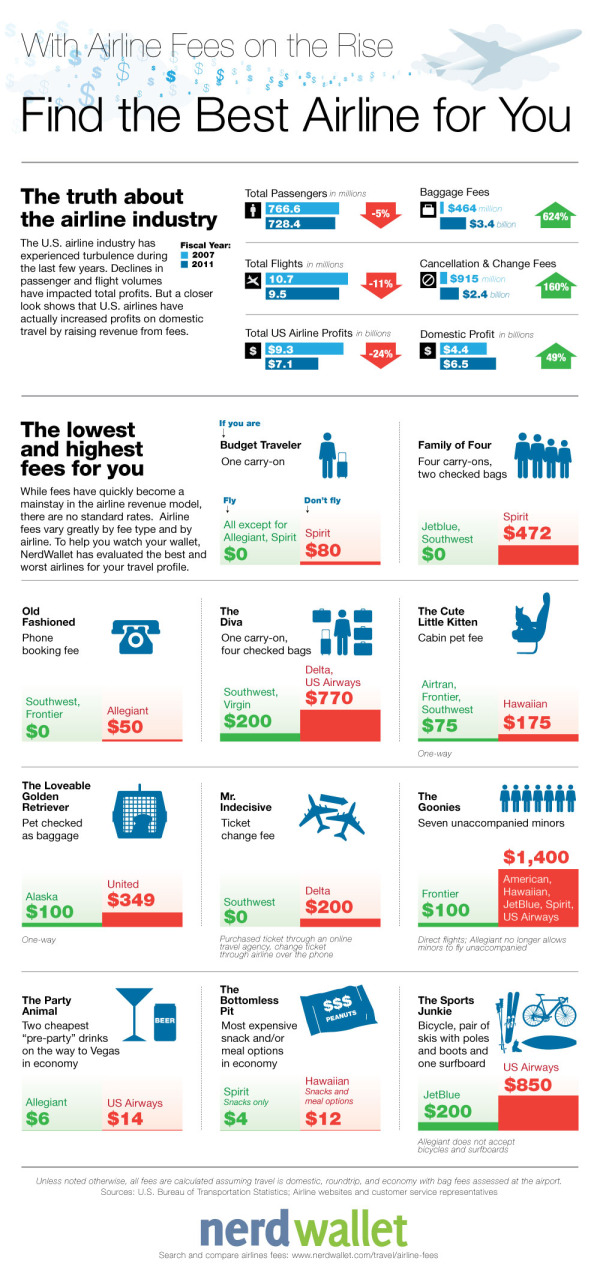
Traveling is a pleasure that we don’t want to give up, but costs keep rising! Find the Best Airline For You infographic from Nerd Wallet lets you know which airline to travel on depending on your traveling habits to keep the costs down!

U.S. airlines continue to increase fees - more fees and higher fees.  However, there are no standards or regulations when it comes to airline fees so travelers don’t know what to expect.  Fee prices range widely by airline, and there is little transparency on the terms of each fee.  For example, some fees are charged based on how stops are made, while others are billed as flat fees.  Some fees have a base rate but increase from the time of booking to boarding the plane.  
As a result, cost comparison is extremely difficult, especially when travelers are evaluating multiple airlines.  To make matters worse, fees are not properly disclosed – they are hidden within multiple layers on airlines’ websites and shrouded by vague wording.  NerdWallet gathered the data and analyzed each fee across all major U.S. airlines.  To help travelers save money, we defined several traveler profiles and calculated fees on a comparable basis to determine which airline is best (and worst) for each type of traveler.

There are a handful of things I like about this one.  

  • The main thing is that throughout all of the Lowest/Highest comparisons, the scale of the bar charts is kept consistent.  This allows the reader to easier understand how much money is related to each travel fee.
  • The green-red (good-bad) color scheme is instantly understandable to the reader.
  • The icons (all in blue) are easy to understand.  By keeping them all a consistent solid blue color, they are kept simple and don’t create a bunch of “visual noise” that would distract the reader.
  • Sources are listed at the bottom
  • The direct URL to the original infographic is included at the bottom so readers can find the high-resolution original no matter where they find it posted on the Internet.

I would suggest using the airline logos, even in a solid color, to make it easier for the readers to pick out the airlines they recognize.

Thanks to Annie for sending in the link!

Thursday
Jun212012

Kelly Slater: Greatest Athlete of All Time?

Quiksilver - Kelly Slater Infographic

Kelly Slater: Greatest Athlete of All Time? is a design collaboration between InfoNewt (my company) and the design team at Quiksilver.

It is common knowledge among our tribe that June 20th is recognized as International Surfing Day so who better to celebrate then Kelly Slater, 11X ASP World Champion. In the spirit of ISD, we’ve created an Infographic comparing Slater to athletes from traditional sports who have made history and measured their achievements to our Champ’s. Have a look and decide for yourself if Slater truly is “The Greatest Athlete of All Time”.

Do you think Kelly Slater is “The Greatest Athlete of All Time”? If yes, share this with your friends and get ready for summer with a pair of Kelly’s Cypher Nomad Boardshorts.

Of course it’s difficult to compare athletes from different sports, but Kelly Slater’s surfing achievements are truly impressive.  Despite being both the youngest and the oldest to win the ASP World Champion title, holding three Guinness World Records, winning 11 Would Tour Championships and winning events in 11 different countries, Kelly Slater has never been on the cover of Sports Illustrated.  :(

Here are some of the design aspects that this infographic gets right:

  • The key message is communicated within the first couple of seconds.  Even if a reader doesn’t read the whole infographic, they will leave understanding the key message.
  • Visually appealling with vivid, colorful images, but still easy to read top-to-bottom.
  • Intergrated the visual brand style of Quiksilver using photos, with the data visualizations about his career.
  • Good mix of different data visualization styles that are unique to the data they communicate
  • The key parts at the bottom are all there.  Data sources, brand logo, copyright statement and the URL to the original, full-size infographic.

The data for this design was the key challenge, and finding similar titles or awards in the other sports inspires discussion and debate among readers of the infographic.  Whether it’s on Facebook, Twitter or blog comments, this design draws in readers and invites everyone to share their own opinion.

Check out the full-size infographic HERE, and you can voice your own opinion about Kelly Slater in the comments below.

Thanks to the team at Quiksilver for being fantastic to work with!

Monday
Apr022012

Interactive Infographic: Coca-Cola vs. Pepsi


The Coke VS. Pepsi: The Cola Wars infographic from cnntees.com. Which side are you on?

For over a century Coke and Pepsi have been at each other’s throats in a constant struggle for a bigger piece of the billion-dollar soda market. 

Along the way the companies have picked up a slew of loyalists and fans, adamant that their cola reigns supreme. While there are countless spots online to check out the history of either company we decided to put together an interactive infographic, putting all cola war highlights together in one spot.

This is a really fascinating experiment with infographic design.  Although it appears to be a static infographic, it’s actually interactive.  If you look closely, there are two videos built directly into the middle of the infographic that play when clicked.  The growth chart at the top is also interactive.  Click on a decade, and then choose the specific year, and it displays events in each companies history related to that time period.

The interactivity is so subtle though, most people will probably miss it without me spelling it out in the title and here in the commentary.

The financial stats section is a really poor use of pie charts in the bottle caps.  The logo images work, but pie charts are for visualizing percentages.  Here, they forced the data into the cute visual, but it makes the data confusing and hard to understand.    Are the charts visualizing the percentages of each expense related to total revenue, or just arbitrarily visualizing the values to represent the comparison between the two companies?  No percentages are shown, and no values are shown for the values of the total pie.  This is forcing a round peg into a square hole.

At the bottom, it’s missing a URL to the original blog post (so readers that find this on the Internet can find the original high-resolution infographic), a copyright statement, a trademark statement and a credit to the designer.

Thanks to Ron for sending in the link!

Thursday
Mar222012

The Health Benefits of Guinness vs. Beer

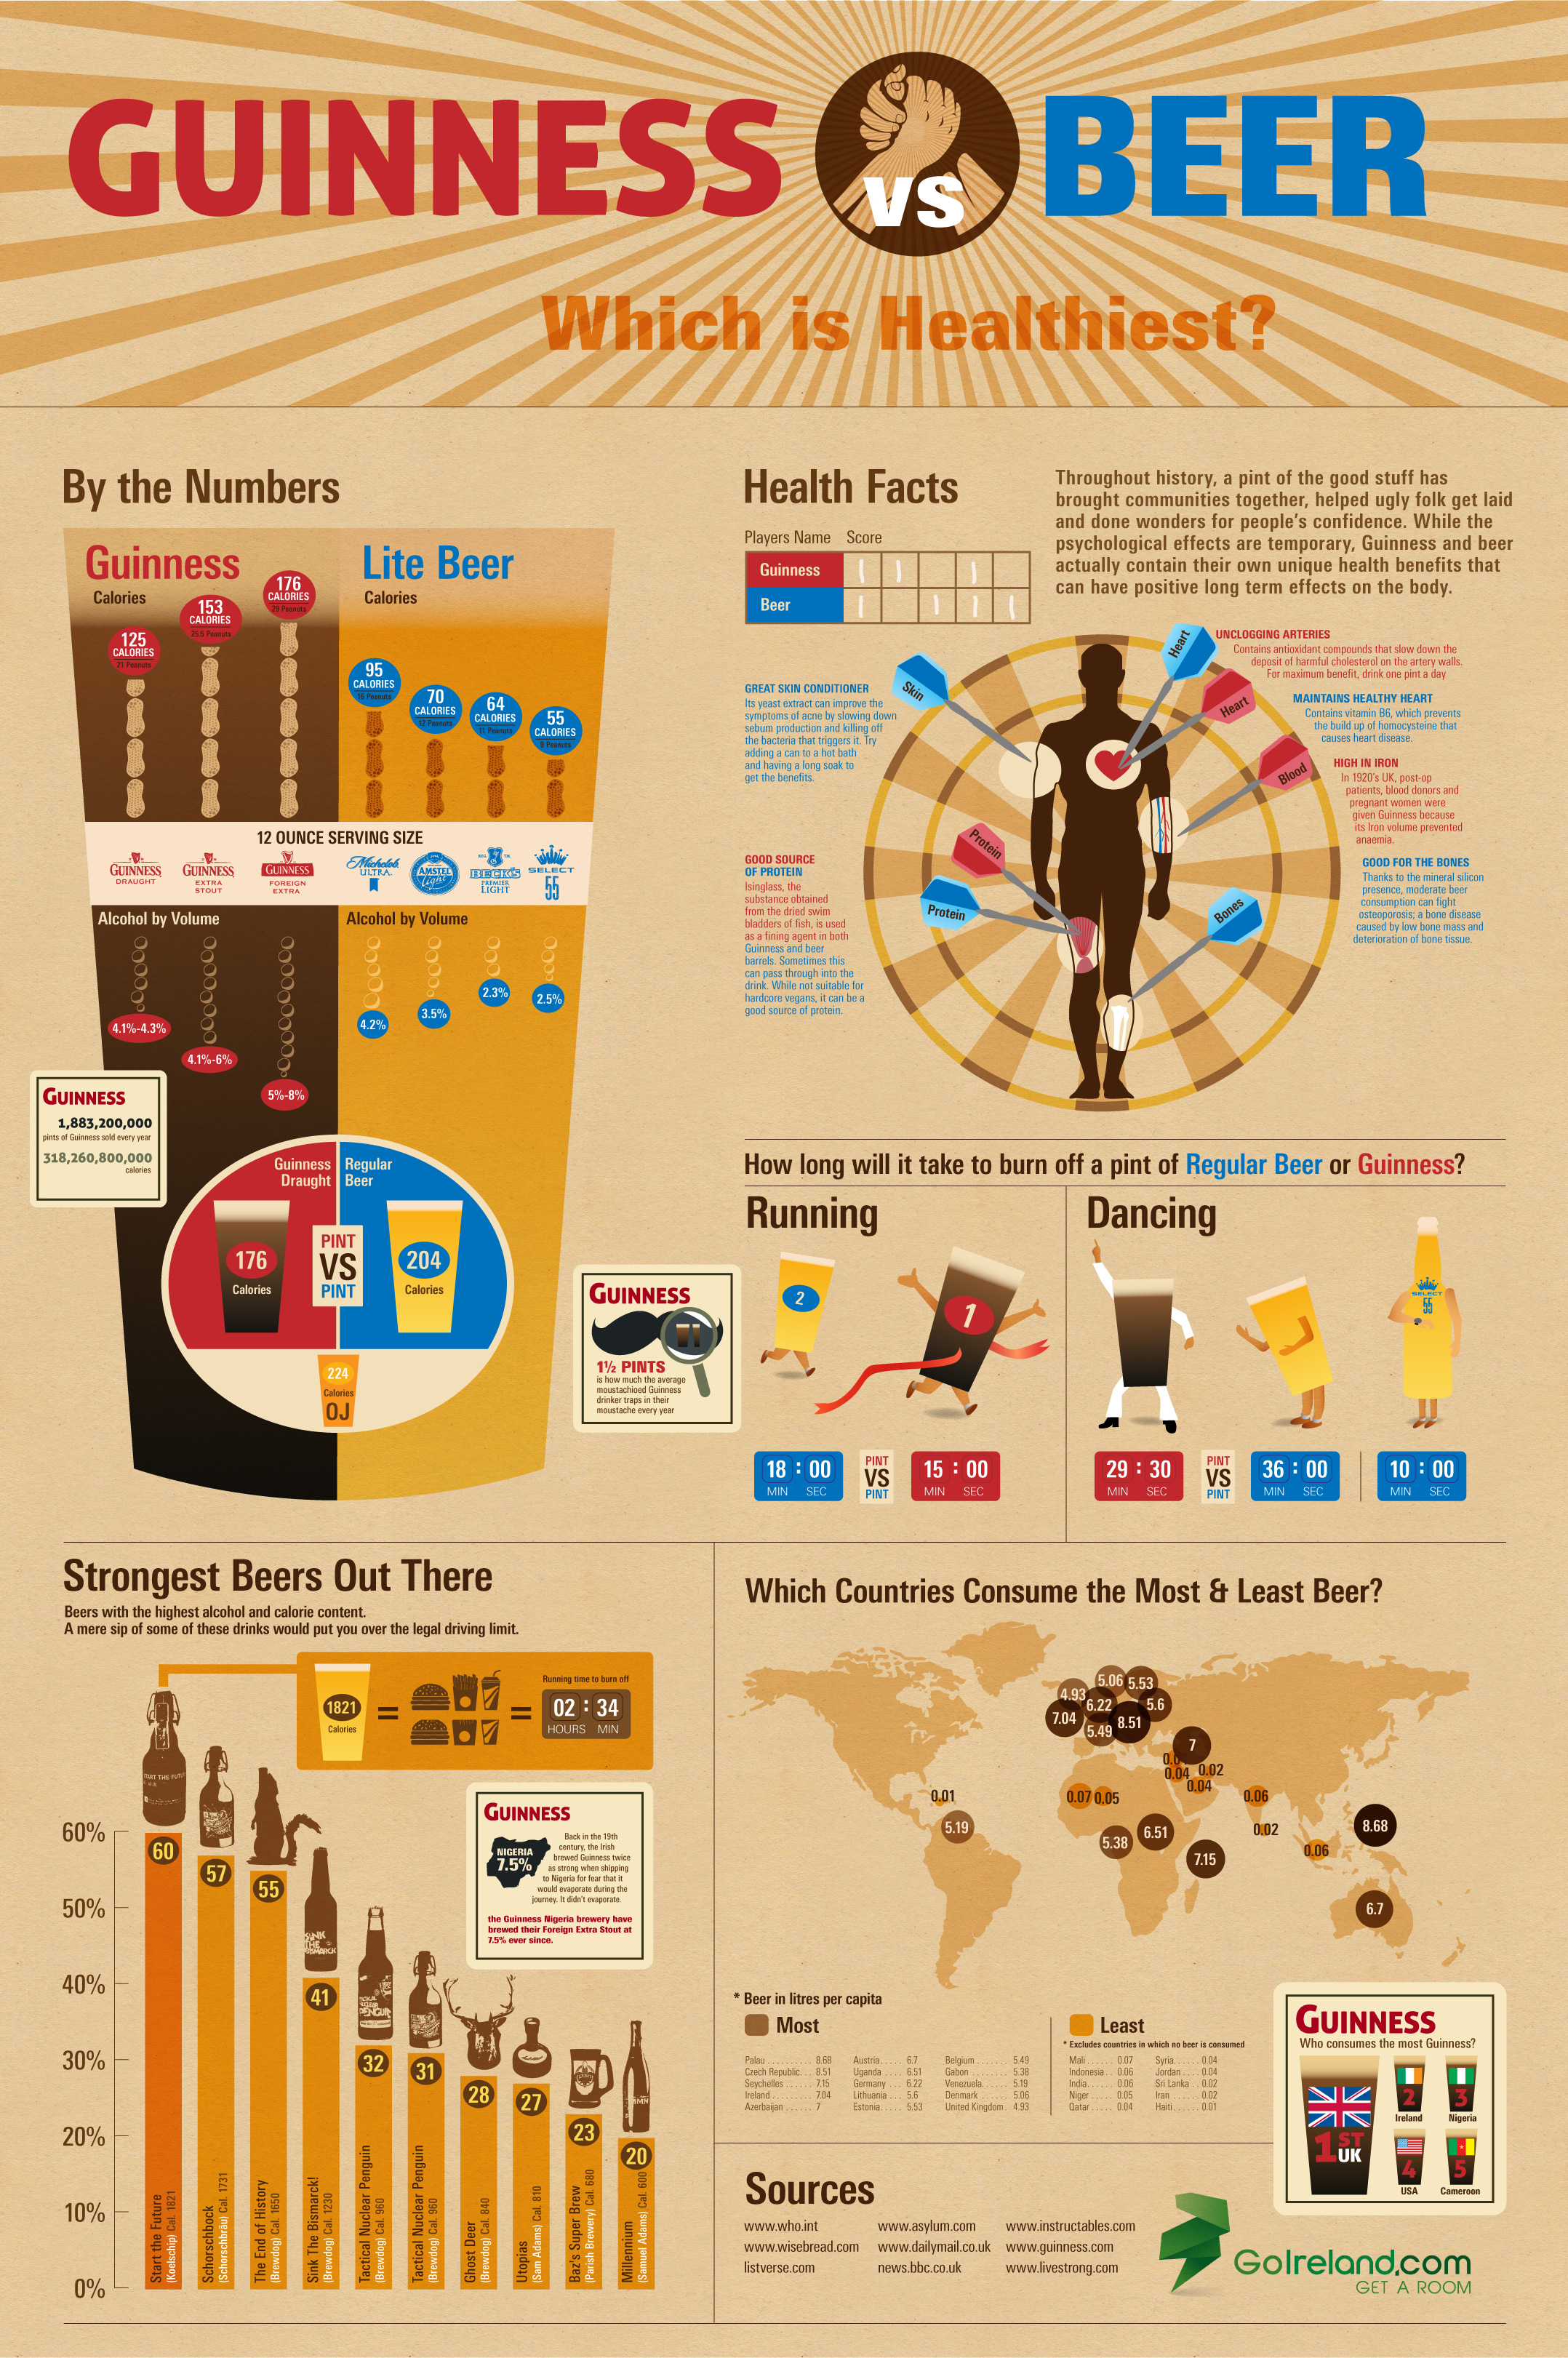
The Health Benefits of Guinness vs. Beer is a new infographic from the team at GoIreland.com.  Primarily focused on calories, this infographic does a good job at visualizing comparisons.

We at GoIreland have rustled up a useful infographic about Guinness and other beers. But not just any infographic about booze. We recognize that folks in the 21st century are more health conscious than ever, so have combined these two facets to look at the health benefits of Guinness vs. other types of beer.

Whether you enjoy the dark stuff, or lean towards lager, the results show that a pint of one, or the other, can have positive effects on various areas of the body, such as the heart, bones and even your skin. Through painstaking research, we even worked out how many individual peanuts each drink is the equivalent to eating, how long it would take to burn off those calories and taken a look at some of the strongest beers known to mankind.

This infographic is really well designed, and it’s focused on one of my favorite drinks in the world!  The visual comparison between Guinness and a handful of light beers is clear and easy to read.  However, when they start comparing to “Regular Beer” it’s unclear what brand they are using as the average beer and where that data comes from.  I like the Running and Dancing comparisons that are fun and make understanding the differences easier to an average reader.

The only visualization error I see is the circles on the world map.  Circles have to be sized by their AREA, so if we assume the Ireland circle is the correct baseline, then the circles for values of 0.06 and 0.02 would only be a couple pixels wide.  The circles in the design are shown larger than their actual values, which is a false visualization.

At the bottom, I wish there was a URL to the original landing page for readers to get back to the original, and some form of copyright statement.

Thanks to Oli for sending in the link!

Here is an alternate, shorter and in my opinion “better” version.  What do you think?


Tuesday
Mar202012

Brand Madness! Social Media Bracketology

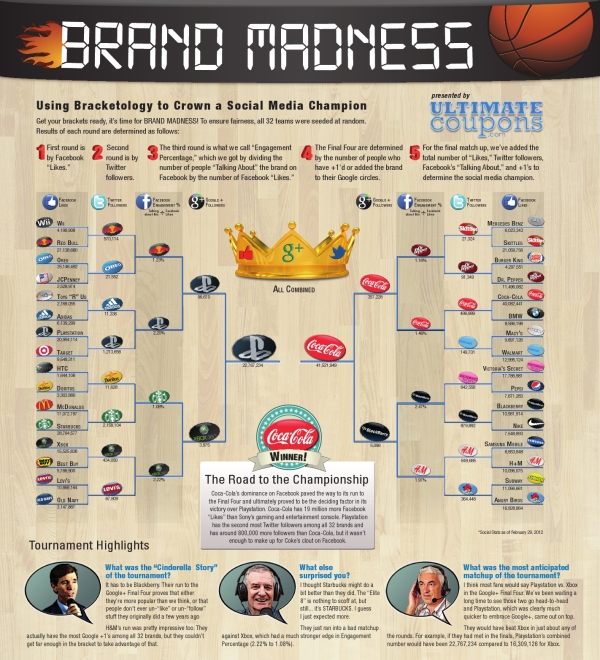
Brand Madness! Using Bracketology to Crown a Social Media Champion is a fun infographic design during the NCAA basketball tournament that uses social media scores to determine winning match-ups.  From UltimateCoupons.com, this design is a great example of taking boring data (Facebook likes and Twitter followers are available to anyone) and using infographic design to make it fun and engaging to the readers.

March Madness has officially arrived, but the UltimateCoupons.com team has Brand Madness! While everyone else’s mind is on basketball, we decided to fill out a bracket pitting 32 of the world’s most popular brand names against each other with the winners and losers being decided by social media popularity.

This is a great use of the visual company logos and the bracket structure to show the readers all of the match-ups, and you can look closer to see the actual numbers if you want to.  Only a year or two ago, this type of blog post would have been all text and a table of numbers, but this is a simple and very effective use of design to grab the readers’ attention.

Thanks to Scarlett for sending in the link!

Tuesday
Feb142012

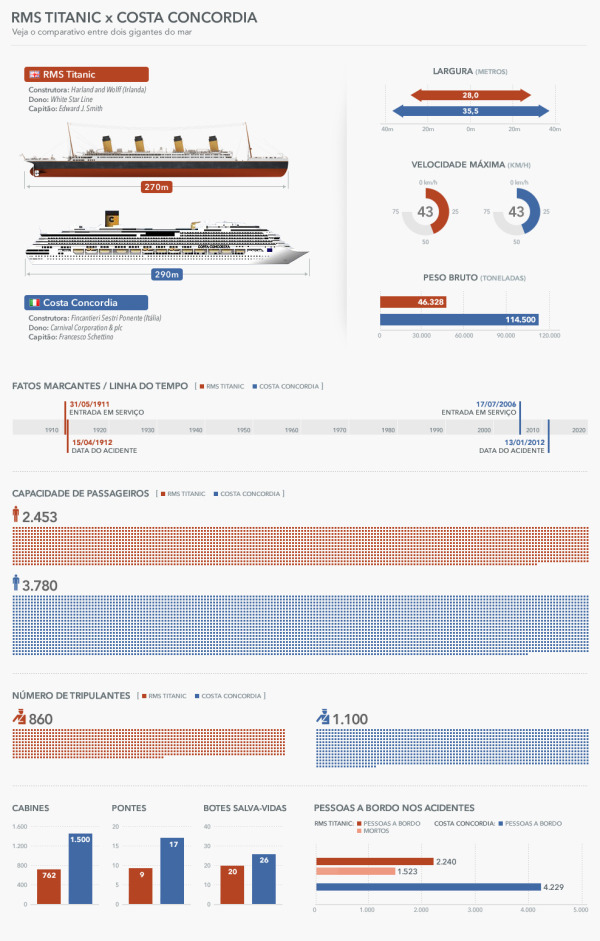
Sinking of the RMS Titanic vs. Costa Concordia

RMS Titanic vs. Costa Concordia (Veja comparação entre o naufrágio do Costa Concordia e do Titanic infographic) from Ultimo Segundo in Brazil compares the crash of the Costa Concordia (Blue) to the Titanic (Red).

Alguns dos sobreviventes do acidente do Costa Concordia compararam o naufrágio do navio italiano, que tombou após bater em uma rocha na costa da Ilha de Giglio em 13 de janeiro, com o do Titanic. “Concebido para ser inafundável”, segundo a operadora White Star Line, o RMS Titanic naufragou em 15 de abril de 1912 após ter-se chocado com um iceberg no Oceano Atlântico duas horas e quarenta minutos antes, na noite do dia 14.

ENGLISH TranslationSome of the survivors of the crash of the Costa Concordia compared the sinking of the Italian ship, which sank after hitting a rock on the coast of the island of Giglio on 13 January, with the Titanic. Designed to be unsinkable,” according to the operator White Star Line, RMS Titanic sank on April 15, 1912 after it collided with an iceberg in the Atlantic Ocean two hours and forty minutes before the night of the 14th.

What a great design!  The best thing about this design is that it’s in Portuguese, but the visuals still make it understandable to anyone that doesn’t know the language!  I understand the comparison between ship sizes, the dates of service on the timeline, the passenger capacities and the number of people aboard during the final accidents.

Thanks to Guilherme for sending in the link!

Monday
Feb132012

The Social Brand Value of the World's Leading Brands

The Social Brand Value of the World’s Leading Brands infographic from Sociagility.

In November 2011, we looked at the social brand value of 50 of the world’s leading brands, creating a revised top 50 ranking according to their social media performance, as measured by our PRINT Index™ KPI.

The PRINT system compares brands on five key dimensions or ‘attributes’ of social media performance – popularity, receptiveness, interaction, network reach and trust – across multiple platforms. The Sociagility Top 50 report analyses the social brand value of the world’s leading brands and the competitive influences that determine their social media performance. Here’s a visual representation of just some of the report highlights.

I really like both the topic, and the design of this infographic.  The colors are bright, and appealing.  In the Top 20 Brand Leaders, I suggest that using the actual brand logos would have made the bar chart easier to understand.  It’s interesting that beyond the first section, the actual values aren’t shown along with the visualizations. I really like the circles comparison of the three attributes of each brand.

Also, “Legends are Evil”.  The color coding by market is at least a secondary level of data, but the legend still makes the reader work harder by looking back-and-forth to understand the meaning behind the colors.  It’s even harder as you move down the infographic, because the color coding continues, but the legend is way up near the top.  You could put icons or the text into the color bars themselves, and the reader would figure out the color coding scheme. 

At the bottom, a copyright and the URL of the original infographic would make it easier for readers to find the original posting.  Some credit to the designer would be nice as well.

Found on DR4WARD.