About
Randy Krum
President of InfoNewt.
Data Visualization and Infographic Design

Infographic Design

Infographics Design | Presentations
Consulting | Data Visualizations

DFW DataViz Meetup

Join the DFW Data Visualization and Infographics Meetup Group if you're in the Dallas/Fort Worth area!

Search the Cool Infographics site

Custom Search

Subscriptions:


Feedburner

The Cool Infographics® Gallery:

How to add the
Cool Infographics button to your:

Cool Infographics iOS icon

- iPhone
- iPad
- iPod Touch


Read on Flipboard for iPad and iPhone

Featured in the Tech & Science category

Flipboard icon

Twitter Feed
From the Bookstore

Caffeine Poster

The Caffeine Poster infographic

Entries in money (137)

Thursday
Mar132014

How Will You Make Your 2014 Numbers?

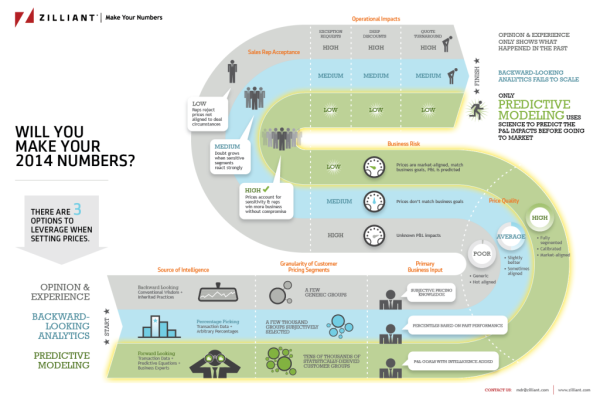
A good B2B infographic design, How Will You Make Your 2014 Numbers from Zilliant gives you 3 options to leverage when setting prices. Good luck making your numbers!

Pricing is the most powerful lever a company has to boost profitability, yet it is often the last bastion of guesswork in many companies.

When it comes to setting prices, what we typically see is that B2B companies take one of three distinct approaches: opinion and experience, backward-looking analytics and predictive modeling.

Where does your company fall? Take a peek at this infographic and find out!

I’m definitely seeing a big increase in design requests for B2B infographics that can be used in presentations, brochures and handouts.  This design is a great example of showing how their service outperforms the alternatives.  The design was sized to fit on standard size paper, so anyone can print it out.  The racetrack path also walks the audience through the information in a very specific sequence.

Thanks to Danielle for sending in the link!

Thursday
Oct312013

Highest Grossing Movie Franchises

Highest Grossing Movie Franchises infographic

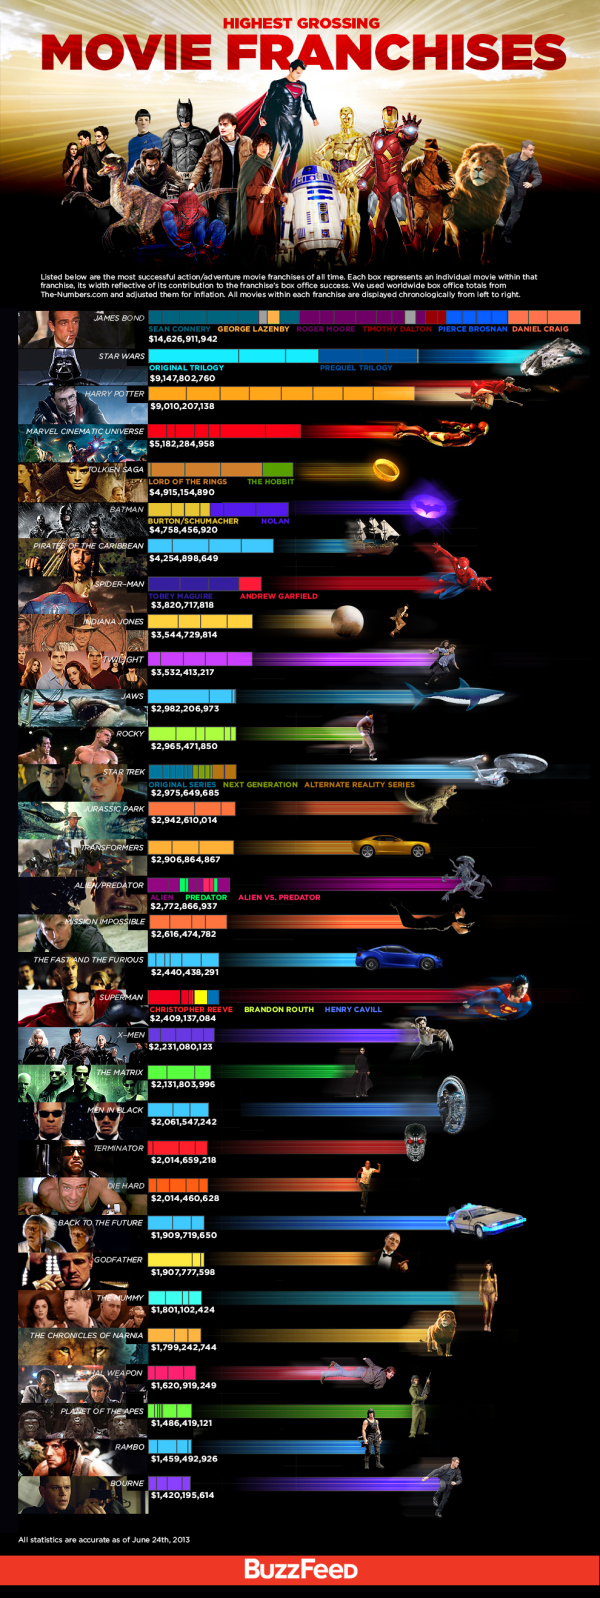
The Highest Grossing Movie Franchises infographic from Buzzfeed makes good use of a stacked bar chart to put the various movie series into perspective. Design by John Gara.

Listed below are the most successful action/adventure movie franchises of all time. Each box represents an individual movie within that franchise, its width reflective of its contribution to the franchise’s box office success. We used worldwide box office totals from The-Numbers. com and adjusted them for inflation. All movies within each franchise are displayed chronologically from left to right.

Great design that really does a fantastic job of comparing the franchises.  I’m especially impressed that they took the time to adjust the data for inflation, a step that designers normally forget.  The color coding within each franchise is also easily explained with colored text under the stacked bars.  No need for a chart legend!

The franchises are sorted in descending order as shown by the bars, but the extra graphic design to the right of each bar is visually misleading.  To some, this will look like an extension of the data, but it’s just artistic, with the images spaced out so they don’t overlap.

The footer should have included both a copyright statement, and the URL link back to the original landing page so readers can find the original full-size version.

Found on GeekTyrant

Thursday
Oct172013

What is the Debt Ceiling?

What is the Debt Ceiling infographic

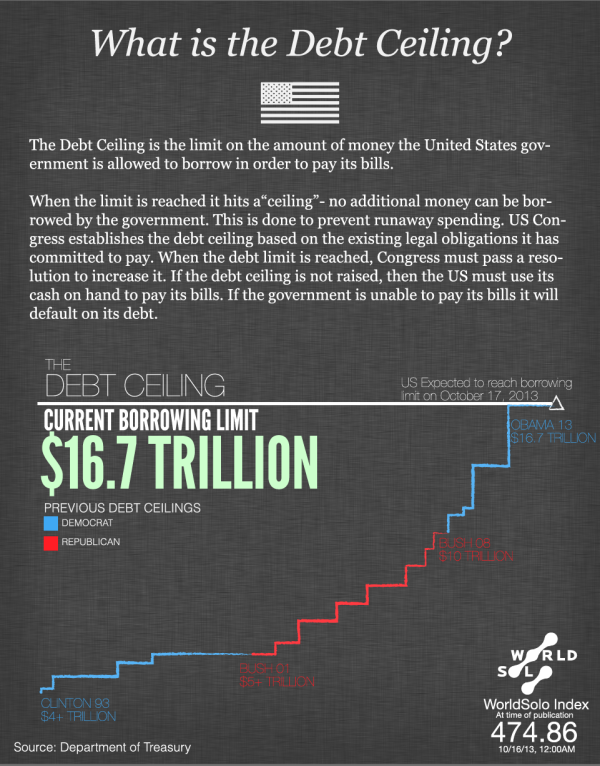
What is the Debt Ceiling? from WorldSolo Index does a good job of using the combination of charts and text to make a complex issue more understandable to the readers.

The US Debt Ceiling is explained. The US is expected to reach its borrowing limit by Oct 17, 2013 if the borrowing limit is not raised. This infographic breaks down the debt ceiling in detail.

Good design that focuses on telling one story really well.

Found on Visually

Monday
Aug262013

Where Does the Money Go?

Where Does the Money Go? infographic

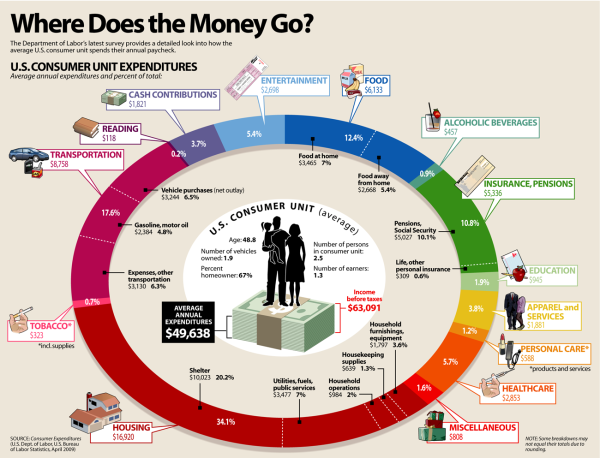
Where Does the Money Go? from LifeHacker breaks down the average spending habits of U.S. consumers.

The graphic above breaks down how the average US household spends their paycheck, according to the US Department of Labor. As you can see, housing, transportation, and food are the biggest costs. Because they take so much out of our paychecks, it makes sense to concentrate on reducing spending in these areas.

Designed as a infographic piece of a larger article, the design does a good job of focusing on one data visualization.  It also has minimal text because the additional details are all included in the text of the article.

Because the graphic can be shared separately from the article, the infographic should include a mention of the article, LifeHacker’s logo, and the URL back to the original.

Thursday
Aug222013

Worldwide ATM Cyber Attack

World Wide ATM Cyber Attack infographic

The Worldwide ATM Cyber Attack infographic from 41st Parameter talks about the international internet heist that stole $45 Million in May 2013. The infographic centers around how they did it, what they took, and then how it could of been stopped.

Most people gasped at today’s headlines about the massive, $45 million ATM heist, which was engineered by a highly-organized gang of cybercriminals. Consumers and banking executives alike have the same worry today: Is their money and account information safe?

Here at 41st Parameter, the news simply highlighted what we already knew – financial institutions are extremely vulnerable to increasingly sophisticated cyber criminals who, as in this case, are able to steal data from pre-paid ATM cards and then quickly loot machines across the globe.

Most banking systems today are connected directly or in-directly to the Internet. This brings about a multitude of unintentional exposures, all of which allows criminals to exploit them to their advantage.

Given the scale of the global credit card networks, it is almost impossible to detect every kind of attack. Similar to fighting terrorism, you can be successful in preventing something 100 times, but the bad guys only need to be successful once.

Banks and financial institutions should use all of the available data and fraud detection solutions to fight fire with fire – and build better defenses for the 21st Century. Indeed, the shocking $45M price tag for banks should be a call to action to put better protections in place. This attack is NOT the last one, and if the modus operandi proves to be successful, crooks will exploit it time and again.

Good use of an infographic as a step-by-step visual explanation.  Good source listing with the URL directly to the detailed news article.  The footer should include a copyright statement and the URL to the original infographic landing page so people can find the full-size version after seeing the infographic on other sites. 

Thanks to Caroline for sending in the link!

Friday
Jul262013

Death & Taxes 2014 Poster and Interview

Death & Taxes 2014 poster infographic

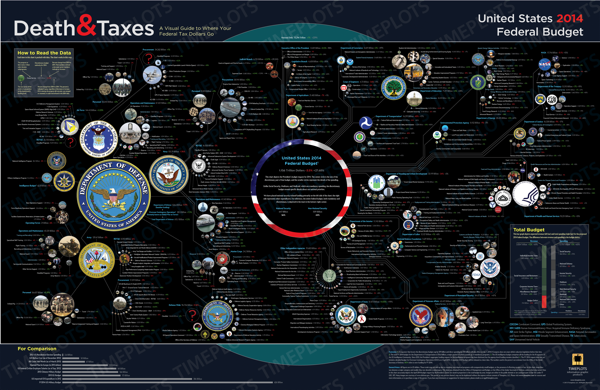
The new 2014 Death & Taxes poster has been released, and it is fantastic!  Visualizing the President’s proposed budget for next year, each department and major expense item is represented with proportionally sized circles so the viewer can understand how big they are in comparison to the rest of the budget.

You can purchase the 24” x 36” printed poster for $24.95.

Since 2004, Death and Taxes has been depicting the federal budget and has grown into a powerhouse of information.

For the FY2014 budget, this poster contains over 500 departments, agencies, programs and just about everything else the government can spend money on. It is still the single most open and accessible record of government spending ever created. All in six square feet. 

Previously, the Death & Taxes series has been a project of Jess Bachman (ByJess.net), but this year the series has been taken over by the great team at Timeplots.  Owner Nathaniel Pearlman graciously spent some time answering some of my questions:

Cool Infographics: What’s new in the 2014 design of Death & Taxes?

Nathaniel Pearlman: Timeplots is continuing the Death & Taxes poster franchise, taking it over from its creator, Jess Bachman. We agreed to do this before the scheduled release of the FY2014 budget. To produce the poster efficiently and meet the expectations of an audience already familiar with its look and feel, we minimized big changes and largely stayed with Jess’s design aesthetic. We kept the location of departments, labeled and colored expenditure numbers in the same format; and, the Office of Governmental Ethics is still the smallest circle plotted on the poster. We did, however, make some subtle design changes.

In the bottom-right corner we converted pie charts to a bar chart. We also changed the “For Comparison” section bubble charts to horizontal bar charts. Bars also serve as a visual clue that the information here is different and you see immediately that they differ from the bubbles depicting the discretionary budget in the main area of the poster. We also unified the presentation style throughout the poster. We also omitted the “How much does it cost you” section. 

Cool Infographics: The Death & Taxes poster design is now being made by the team at Timeplots, what are the major differences from the prior posters that were designed by Jess Bachman?   

Nathaniel Pearlman: Timeplots has a four year history of visualizing complex data with compelling design. We have diverse skills and resources and may introduce changes in future posters like dark type against a lighter background for ease of reading; advancing visual unity either by replacing the photos with icons, or by making all color photographs more duotone, or monochromatic; and finally, crafting the type in the header section so that it has more personality. We are also thinking about how to improve the substance of the poster. We would love to hear feedback or suggestions for improvement from your readers.

Cool Infographics: When did the 2014 data become available, and how long did it take you design the poster?

Nathaniel Pearlman: The data was released on April 11, 2013. To prepare, we wrote some data queries and scripts based on the 2013 data about one week before the release. Once we got the 2014 data, we just ran the 2013 scripts. It took about two days to get all of the circles in place on the poster. The design and crafting took longer. The poster went out for review to experts about a month after the we got the data. Of course we were working on many other projects in between as well.

Cool Infographics: What software applications were used for the Death & Taxes poster design?

Nathaniel Pearlman: Scripting and plotting were done in R—an open source statistical application that we have used for other Timeplots posters. The design completed in Adobe Illustrator. Jess created the previous Death and Taxes with Excel and Photoshop, so there was no code or design template we could borrow or reuse. Our programming and design process was new to Death & Taxes, but we decided to go this route because this process would present data more accurately and make future updating much easier.

Cool Infographics: What’s the most interesting thing you learned from the 2014 data?

Nathaniel Pearlman: We guess it shouldn’t be a surprise, but data shows how trivial in the context of the whole budget are some of the biggest political tangles. Things like the National Endowment for the Humanities or the Corporation for Public Broadcasting are very small by comparison to big ticket items.  The nice thing about the poster is that each viewer will be able to reach their own conclusions, based on the area of they wish to investigate or focus upon. Each department, each item, has its own story. 

Cool Infographics: Where do you have them printed, what are the printing specs and why?

Nathaniel Pearlman: The 2014 poster is on a 36” by 24” sized, 80 lb. cover paper. We use a local printer for offset printing and through a process of several proofs we have more control over the colors and the final look and feel of the print. The 2014 poster is slightly lighter than the 2012 one. The lighter paper can roll more easily into tubes without getting creases.

Cool Infographics: Social media has always been a big part of marketing the Death & Taxes poster.  What are your plans to promote the 2014 poster?

Nathaniel Pearlman: Social media is important to us. We have been receiving supportive comments and thoughtful suggestions through a number of channels. Death & Taxes has its own Facebook channel: (https://www.facebook.com/pages/Death-and-Taxes/373639641532). You can also follow Timeplots on Twitter (@timeplots) and Facebook (https://www.facebook.com/timeplots) to receive notice of latest news. Keep your eyes open to these places.

Graphicacy, (the consulting arm of Timeplots) is also working on an interactive version using the same budget data to pair with the poster. That interactive, presenting the same information, will enable interested viewers to explore the federal budget online.

The poster now sells at Timeplots and Amazon.  

Cool Infographics: Prior versions have been available online in a zooming viewer.  Is the 2014 version also available in this format?  What zooming tool is being used?

Nathaniel Pearlman: Yes, you are able to zoom on a watermarked version of the 2014 poster on our Timeplots site. The zoom tool is the default for our shopping content management system, and it allows for crystal-clear views of the information, watermarks aside. While you will have a good sense for the design and presentation of the poster by viewing it online and zooming-in on its details, we believe the print poster will surprise you with its vibrant colors on smooth paper, sharp type, and scale.

 You can also check out Jess Bachman’s thoughts about the new version in his blog post on Visual.ly

Thursday
Jul252013

PepsiCo Q2 2013 Performance Infographics

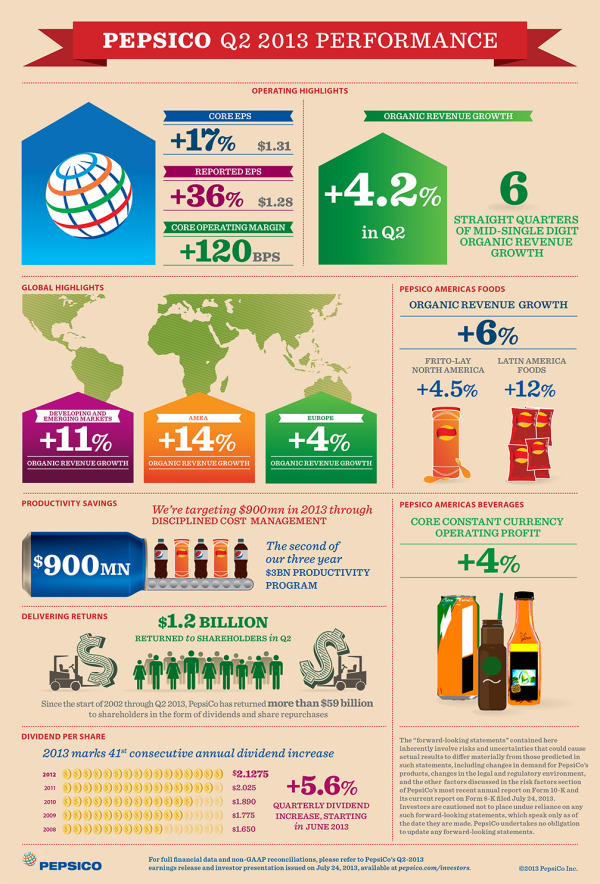
PepsiCo has begun to publish an official infographic along with each of their quarterly earnings reports to investors and analysts.  The PepsiCo Q2 2013 Performance infographic was just released online to coincide with the press release and earning call to analysts.

I love seeing infographics used in this way, and I think we will be seeing many more of them from other companies.  Visualizaing the financial data can make the complex filings much easier for investors to understand.

As much as I love this idea, this particular design needs help visualizing the data.  Big fonts are not data visualizations, and many of the financial stististics presented were shown in text only.  It takes a data visualization to put the values into perspective for the audience, and make them easier to understand.

This is the second infographic in the series.  It appears that each one will be released with a unique website dedicated to hosting the infographic.  This on can be found at: www.pepsicoinfographicq2.com, and a PDF version is also available to download from the site.  You can find the infographic from the prior qurter here: www.pepsicoinfographicq1.com.  The infographics were also published on the PepsiCo Multimedia Downloads section of the Media page.

Thanks to Chris Hoyt for posting on Google+

Monday
Jul152013

The Investfographic

Investfographic

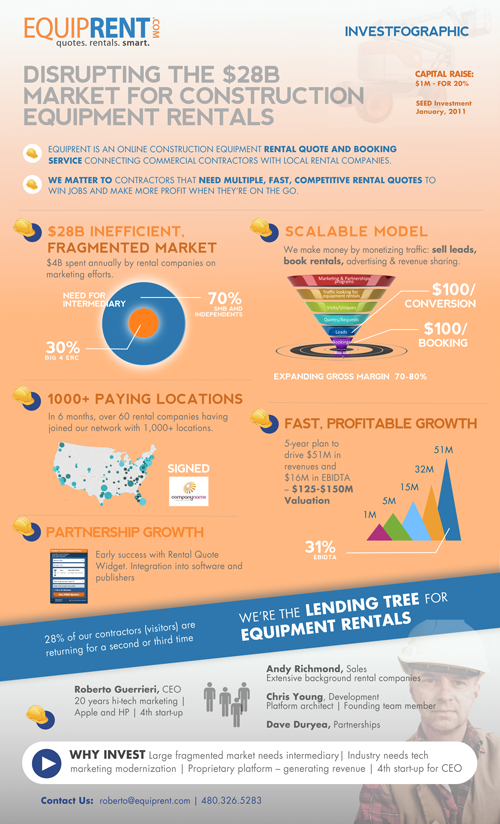
The Investfographic from EquipRent.com is the infographic they designed in-house to share with potential investors. Visual aids and infographics are becoming a valuable tool for companies to communicate with potential investors and shareholders.  Consider this to be a visual elevator pitch.

Using an “InvestFoGraphic” to raise capital

As a serial entrepreneur, I am always looking for an edge that makes a company standout and be noticed during capital raising times.

With the advent of new software tools like Prezi to boost your presentations, we decided to creatively put together a colorful investment infographic handout that completely complied with our goal of keeping our story concise, relevant, and exciting. The typical handout (1-page executive summary) that we had previously given VCs was heavy on words explaining in great detail what our company did and how successful we had been. This new graphic handout was riddled with bold and exciting claims about our company and our industry. The underlying theory behind using the infographic was to hook them first, grab their attention and then be ready to talk business. 

The exciting news is that we are now in final discussions with several investor groups to close our funding. We know the infographic wasn’t the main reason for getting to this final phase, but we do know that differentiating yourself makes you more memorable and shows investors you and your company plan on being different than the massess.

Remember the advice that the great Rod Stewart gave years ago:  Every picture tells a story, don’t it!

The team at EquipRent uses the design as a talking point at investor events.  They found it much easier to point out the visuals and discuss each point with their investors.  They shared with Cool Infographics, a few of the comments made by investors after seeing the design:

  • “I can quickly see what is different about this company than reading a typical one-page executive summary.”
  • “I have never seen anyone use an infographic for investor purposes,  other than to distinguish market trends.”
  • “Definitely sets you a part…like a cool and different resume.”

Thanks to Nate for sending in the link!

Tuesday
Jul092013

Methods to Sell My House in the UK

Methods to Sell My House in the UK is an infographic from YouSellQuick.co.uk that looks at the different ways to sell a house and the financial implications.

When looking to sell your home you may not realise that there are a variety of different options available. Not all are as favourable as others and there are different pros and cons for each. Such as how long will it take to sell my home and what amount of cash can I receive. Should I sell my house at an auction or would it be better to use an on-line property buyer?

I like the diagrams that explain the different processes, but the pie charts have really been used poorly in this design.  I think I nderstand what they were trying to explain, but it won’t be obvious to most readers.  Many readers will think they got the pie chart data wrong because the percentages shown don’t add up to 100%.

Thanks to Mark for sending in the link!


Monday
Jul082013

How Startup Funding Works

How Startup Funding Works infographic

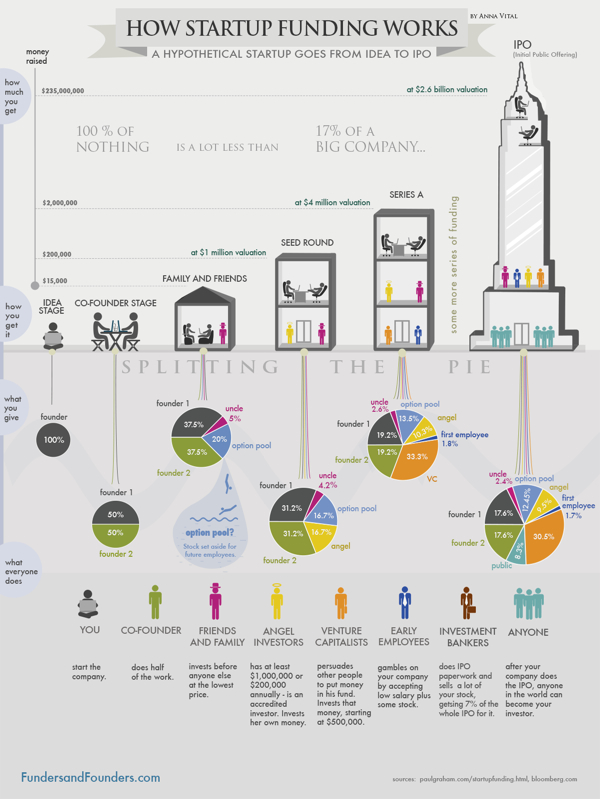
How Startup Funding Works from Funders and Founders co-founder Anna Vital does a great job of visualizing the split of equity at different stages of a company’s life.

A hypothetical startup will get about $15,000 from family and friends, about $200,000 from an angel investor three months later, and about $2 Million from a VC another six months later. If all goes well. See how funding works in this infographic:

Is dilution bad? No, because your pie is getting bigger with each investment. But, yes, dilution is bad, because you are losing control of your company. So what should you do? Take investment only when it is necessary. Only take money from people you respect. (There are other ways, like buying shares back from employees or the public, but that is further down the road.)

This is a great design that uses pie charts correctly and effectively!  This is in contrast to the many designs that use pie charts inappropriately.  This is a great example of a visual explanation that uses a combination of data visualization, illustration and text to tell a clear story.

The color coding is also effective, but for some reason they didn’t color the co-founder icon character green to match his portion of the pies.  The URL link to the original infographic landing page is also missing in the footer, so it makes it hard for readers to find the full-size original version when they see it posted on other sites.  People aren’t always good about creating links back to the original, so the URL should be included in the infographic image file itself.