About
Randy Krum
President of InfoNewt.
Data Visualization and Infographic Design

Infographic Design

Infographics Design | Presentations
Consulting | Data Visualizations

DFW DataViz Meetup

Join the DFW Data Visualization and Infographics Meetup Group if you're in the Dallas/Fort Worth area!

Search the Cool Infographics site

Custom Search

Subscriptions:


Feedburner

The Cool Infographics® Gallery:

How to add the
Cool Infographics button to your:

Cool Infographics iOS icon

- iPhone
- iPad
- iPod Touch


Read on Flipboard for iPad and iPhone

Featured in the Tech & Science category

Flipboard icon

Twitter Feed
From the Bookstore

Caffeine Poster

The Caffeine Poster infographic

Monday
Jul292013

A #Sworcery Infographic


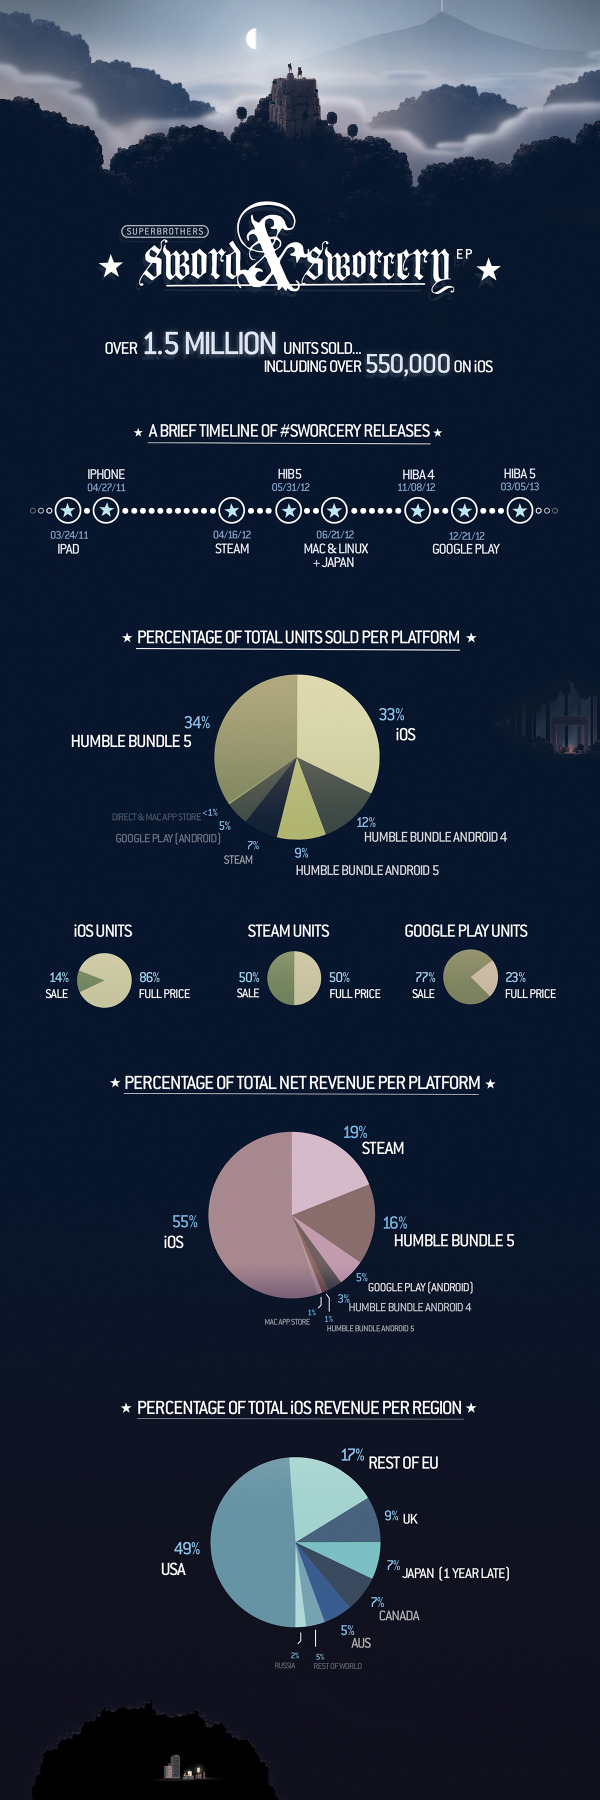
A Sword and Sworcery Infographic

Two years ago Superbrothers: Sword and Sworcery EP was one of the first great games released that was designed specifically for the Apple iPad. Designed by Capybara Games, the game was also later released on iPhone, Android, Windows PC, Linux and Mac based on the huge success of the iPad version.

To celebrate the 2nd anniversary, Capybara Games released the Sword and Sworcery Infographic, and that’s cooler than a Trigon Trifecta!  (Also available on the SwordAndSworcery.com site)

From the Capybara Games site:


On March 24th, 2011 Superbrothers: Sword & Sworcery EP launched on iPad. The first hours after its release were exciting, stressful, celebratory and even terrifying (as game-centric twitter feeds exploded). We watched as the game hit the top 10 paid games chart before we were even featured. Leading up to launch we knew we had made something cool. After launch we knew there was an audience that appreciated it.

Over the next 2+ years, we brought the game to PC, Mac & Linux. We collaborated with the amazing folks from 8-4 to create a version specifically for Japan. With the help of Apportable, we brought the game to Android. We joined our close friends in the most successful Humble Indie Bundle of all time, and joined a great Android Bundle as well.

With over 1.5 million copies sold, it’s pretty obvious that #Sworcery has been a resounding success. And we’d like to share a few details of that success with you. There’s not that many titles out there that began on iOS and made their way to this many other platforms over time, so we hope that this info is helpful in some way/shape/form.


From such a visual game design, I would have liked to see the chart labels as icons of the companies instead of just text labels. Even better as 8-bit icons similar to the design of the game.


As I mention about many infographic designs, the URL to the original infographic landing page should be included in the footer of the design so readers can find the full-size version of the infographic. I had to shrink the infographic image to fit on the blog, like many people, and I always try to link back to the original source. Not everyone is good about linking, and you want the readers to be able to find their way back.

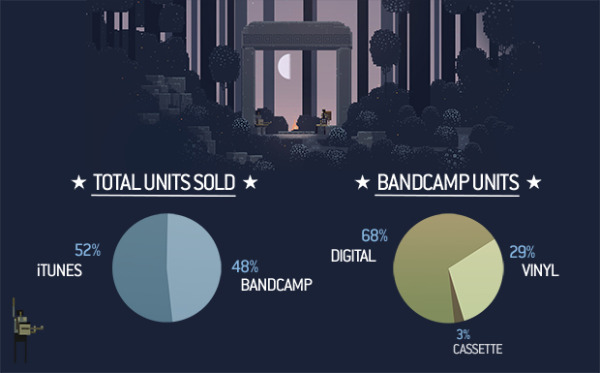
As a bonus mini-infographic, they also released some of the stats behind the music by rockstar & critically acclaimed composer Jim Guthrie soundtrack, Sword & Sworcery LP - The Ballad of the Space Babies, also available on the iTunes store.

Jim Guthrie Stats infographic

Found on The Verge and Daring Fireball.

Monday
Jul292013

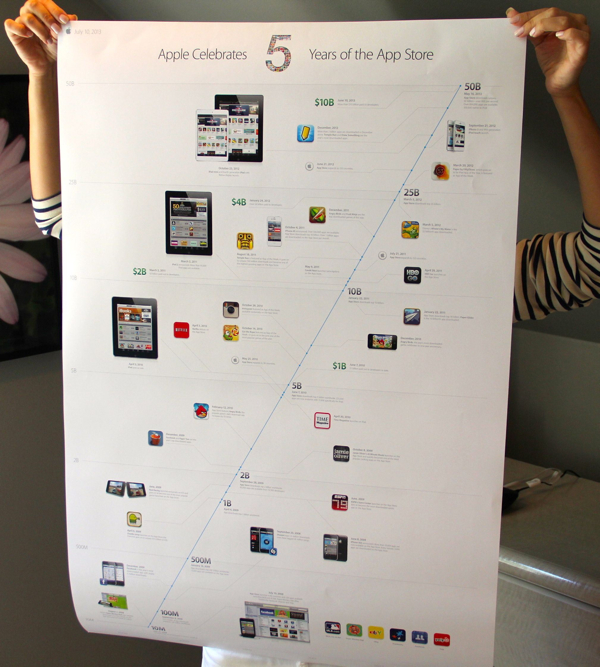
Apple's Infographic Timeline Poster

Apple Celebrates 5 years of the App Store infographic timeline poster

Apple just released the infographic timeline poster, Apple Celebrates 5 Years of the App Store.  Copies of this poster were sent to various members of the press.  The above photo is from Lauren Goode from All Things D.

If anyone has a copy they don’t want, I would love to get a copy!

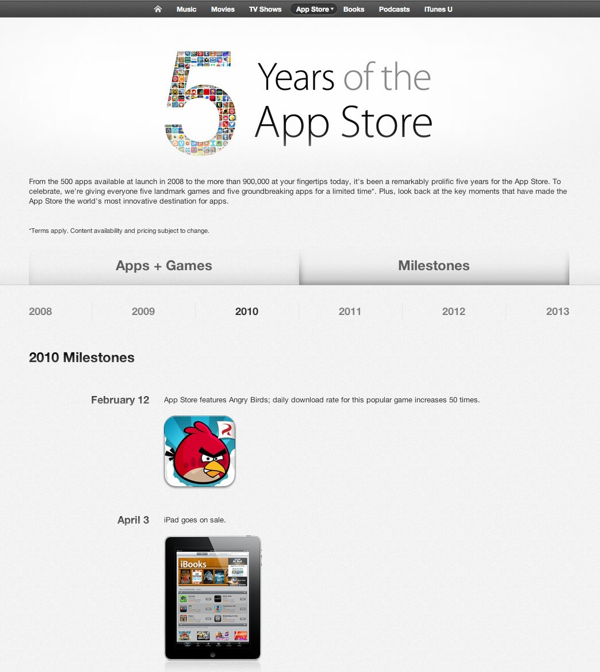
Sadly, no high-resolution versions of the poster are available online, but the data is available to view from within the iTunes Store.  You can see the images, icons and events, but they aren’t laid out like the poster timeline.  You can view the events in iTunes by following this link.

Found on All Things D 

Friday
Jul262013

Death & Taxes 2014 Poster and Interview

Death & Taxes 2014 poster infographic

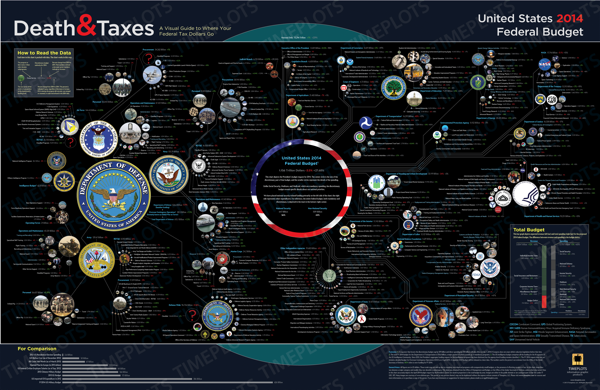
The new 2014 Death & Taxes poster has been released, and it is fantastic!  Visualizing the President’s proposed budget for next year, each department and major expense item is represented with proportionally sized circles so the viewer can understand how big they are in comparison to the rest of the budget.

You can purchase the 24” x 36” printed poster for $24.95.

Since 2004, Death and Taxes has been depicting the federal budget and has grown into a powerhouse of information.

For the FY2014 budget, this poster contains over 500 departments, agencies, programs and just about everything else the government can spend money on. It is still the single most open and accessible record of government spending ever created. All in six square feet. 

Previously, the Death & Taxes series has been a project of Jess Bachman (ByJess.net), but this year the series has been taken over by the great team at Timeplots.  Owner Nathaniel Pearlman graciously spent some time answering some of my questions:

Cool Infographics: What’s new in the 2014 design of Death & Taxes?

Nathaniel Pearlman: Timeplots is continuing the Death & Taxes poster franchise, taking it over from its creator, Jess Bachman. We agreed to do this before the scheduled release of the FY2014 budget. To produce the poster efficiently and meet the expectations of an audience already familiar with its look and feel, we minimized big changes and largely stayed with Jess’s design aesthetic. We kept the location of departments, labeled and colored expenditure numbers in the same format; and, the Office of Governmental Ethics is still the smallest circle plotted on the poster. We did, however, make some subtle design changes.

In the bottom-right corner we converted pie charts to a bar chart. We also changed the “For Comparison” section bubble charts to horizontal bar charts. Bars also serve as a visual clue that the information here is different and you see immediately that they differ from the bubbles depicting the discretionary budget in the main area of the poster. We also unified the presentation style throughout the poster. We also omitted the “How much does it cost you” section. 

Cool Infographics: The Death & Taxes poster design is now being made by the team at Timeplots, what are the major differences from the prior posters that were designed by Jess Bachman?   

Nathaniel Pearlman: Timeplots has a four year history of visualizing complex data with compelling design. We have diverse skills and resources and may introduce changes in future posters like dark type against a lighter background for ease of reading; advancing visual unity either by replacing the photos with icons, or by making all color photographs more duotone, or monochromatic; and finally, crafting the type in the header section so that it has more personality. We are also thinking about how to improve the substance of the poster. We would love to hear feedback or suggestions for improvement from your readers.

Cool Infographics: When did the 2014 data become available, and how long did it take you design the poster?

Nathaniel Pearlman: The data was released on April 11, 2013. To prepare, we wrote some data queries and scripts based on the 2013 data about one week before the release. Once we got the 2014 data, we just ran the 2013 scripts. It took about two days to get all of the circles in place on the poster. The design and crafting took longer. The poster went out for review to experts about a month after the we got the data. Of course we were working on many other projects in between as well.

Cool Infographics: What software applications were used for the Death & Taxes poster design?

Nathaniel Pearlman: Scripting and plotting were done in R—an open source statistical application that we have used for other Timeplots posters. The design completed in Adobe Illustrator. Jess created the previous Death and Taxes with Excel and Photoshop, so there was no code or design template we could borrow or reuse. Our programming and design process was new to Death & Taxes, but we decided to go this route because this process would present data more accurately and make future updating much easier.

Cool Infographics: What’s the most interesting thing you learned from the 2014 data?

Nathaniel Pearlman: We guess it shouldn’t be a surprise, but data shows how trivial in the context of the whole budget are some of the biggest political tangles. Things like the National Endowment for the Humanities or the Corporation for Public Broadcasting are very small by comparison to big ticket items.  The nice thing about the poster is that each viewer will be able to reach their own conclusions, based on the area of they wish to investigate or focus upon. Each department, each item, has its own story. 

Cool Infographics: Where do you have them printed, what are the printing specs and why?

Nathaniel Pearlman: The 2014 poster is on a 36” by 24” sized, 80 lb. cover paper. We use a local printer for offset printing and through a process of several proofs we have more control over the colors and the final look and feel of the print. The 2014 poster is slightly lighter than the 2012 one. The lighter paper can roll more easily into tubes without getting creases.

Cool Infographics: Social media has always been a big part of marketing the Death & Taxes poster.  What are your plans to promote the 2014 poster?

Nathaniel Pearlman: Social media is important to us. We have been receiving supportive comments and thoughtful suggestions through a number of channels. Death & Taxes has its own Facebook channel: (https://www.facebook.com/pages/Death-and-Taxes/373639641532). You can also follow Timeplots on Twitter (@timeplots) and Facebook (https://www.facebook.com/timeplots) to receive notice of latest news. Keep your eyes open to these places.

Graphicacy, (the consulting arm of Timeplots) is also working on an interactive version using the same budget data to pair with the poster. That interactive, presenting the same information, will enable interested viewers to explore the federal budget online.

The poster now sells at Timeplots and Amazon.  

Cool Infographics: Prior versions have been available online in a zooming viewer.  Is the 2014 version also available in this format?  What zooming tool is being used?

Nathaniel Pearlman: Yes, you are able to zoom on a watermarked version of the 2014 poster on our Timeplots site. The zoom tool is the default for our shopping content management system, and it allows for crystal-clear views of the information, watermarks aside. While you will have a good sense for the design and presentation of the poster by viewing it online and zooming-in on its details, we believe the print poster will surprise you with its vibrant colors on smooth paper, sharp type, and scale.

 You can also check out Jess Bachman’s thoughts about the new version in his blog post on Visual.ly

Thursday
Jul252013

PepsiCo Q2 2013 Performance Infographics

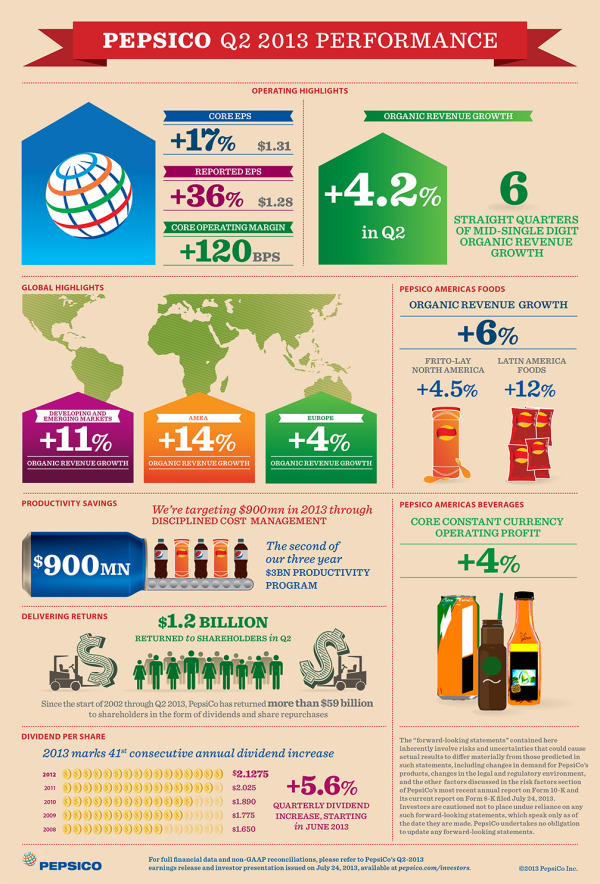
PepsiCo has begun to publish an official infographic along with each of their quarterly earnings reports to investors and analysts.  The PepsiCo Q2 2013 Performance infographic was just released online to coincide with the press release and earning call to analysts.

I love seeing infographics used in this way, and I think we will be seeing many more of them from other companies.  Visualizaing the financial data can make the complex filings much easier for investors to understand.

As much as I love this idea, this particular design needs help visualizing the data.  Big fonts are not data visualizations, and many of the financial stististics presented were shown in text only.  It takes a data visualization to put the values into perspective for the audience, and make them easier to understand.

This is the second infographic in the series.  It appears that each one will be released with a unique website dedicated to hosting the infographic.  This on can be found at: www.pepsicoinfographicq2.com, and a PDF version is also available to download from the site.  You can find the infographic from the prior qurter here: www.pepsicoinfographicq1.com.  The infographics were also published on the PepsiCo Multimedia Downloads section of the Media page.

Thanks to Chris Hoyt for posting on Google+

Thursday
Jul252013

Inside the Courtroom

Inside the Courtroom infographic

Going to court is no laughing matter. But the Inside the Courtroom infographic from Livesay & Meyers balances seriousness with humor as it lays out the blueprint of a courtroom, then tells some funny stories about actual things said in court.

Going to court for the first time can be an intimidating experience. Whether you are facing criminal charges or find yourself in court in a divorce or custody case, remaining calm in court can really help you make your most effective case. We put together the infographic below to help you understand all the different parts of the courtroom, so you can feel at ease on your day in court. This infographic explains who people are, what they do, and where they sit. We’ve also included some interesting facts about courtrooms, and funny quotes from actual court cases.

Our experienced attorneys feel right at home in the courtroom– hopefully this information will allow you to also be at ease in front of the judge or jury.

Thanks to James for sending in the link!

Monday
Jul222013

What the Health? Understanding Obamacare's 11 Year Health Plan

What the Health? Understanding Obamacare's 11 Year Health Plan infographic

Interested in the new health plan but have no idea what it means? What the Health? Understanding Obamacare’s 11 Year Health Plan infographic from Clarity Way breaks down each year of the 11-year health care plan of Obamacare. 

If the re-election of Barack Obama as America’s 44th President of the United States means anything, it is that American citizens can expect a little more consistency within their legislation. Among the most notable acts of legislation promised by Obama during both of his campaigns for the Presidency was the concern over America’s health care system.

When our 44th President first earned his chair in leading the nation, he immediately took initiative to put into action a new proposal for health care reform called the Affordable Care Act. And now that he has regained his position, we can count on seeing this initiative furthered in the next 4 years!

But among this 11 year plan was a ton of confusing political jargon, making it easy for Americans to misinterpret how the Act would impact themselves and their nation. So as a duty to our followers and role in the promotion of health, we wanted to create a little bit easier of an explanation of the Affordable Care Act!

This health reform infographic breaks down the Affordable Care Act in an effort to explain how it will affect each and every citizen, from small businesses to large ones, college students to parents, and senior citizens to the young! It’s important that you know about the Affordable Care Act and understand that if we had maintained our status-quo, over 14,000 Americans would lose their health insurance daily!

I think there’s too much text in this design, but it does walk the reader through each year, step by step.  The statistics should have been visualized.  Big fonts are NOT data visualizations, and I see this done by designers all the time.  Big fonts don’t provide any context, and don’t make the numbers any easier for the audience to understand.

Thanks to Adrienne for sending in the link!

Friday
Jul192013

Units of Measure Calendar

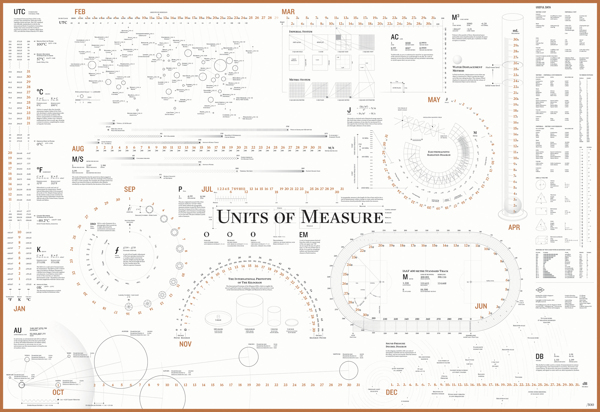
An intriguing calendar that shows the date by using units of measurements commonly used. Designed by the team at ACRE in Singapore, you can buy your own Unit of Measure Calendar poster. There are two editions, a blue and black version as well as a black and copper.  

The idea of creating a calendar was always at the top of our heads. However, we needed an idea that was sound, that made sense. We went back to our roots for that big idea, and we stumbled upon the fact our agency is named after a unit of measure.

Things began to click into gear and the team worked to create a calendar that would highlight 12 units of measure . This brought a lot of symmetry to our design philosophy which melds sense and practicality together. This craft-centric calendar is designed to be practically functional as well as aesthetically pleasing. 

I do wish the high-resolution version was available to view online, but we can only see the gallery images.


Dimensions: 990 × 680 mm (39 × 26.75 in)

Found on Fast Co Design

Wednesday
Jul172013

Kim Rees and Dino Citraro - What Makes an Infographic Cool?

Guest Post by Kim Rees and Dino Citraro


When an Infographic Isn’t

Infographics are popular, useful, and seem to be an established part of our vernacular these days. They are easy to read, quick to digest, and for the most part, can require less work to create than a more in-depth data visualization. However, as with many things that are popular and useful, they have a dubious imposter that is frequently wrongly categorized. 


Digital Posters

Digital Posters are everywhere and almost entirely presented under the auspices of being an Infographic. These distant cousins confuse the definition of an Infographic because while they often might be easy to read and quick to digest, they fail to expand the essence of the data by adding context and metaphor. 

A collection of cats holding a variety of mobile devices may be adorable, but it is not an Infographic. A huddle of celebrities who all have a similarly peculiar personality trait might curious, but this also, is not an Infographic. Extremely large numbers surrounding nicely formed text treatments is not an Infographic.

All of these are examples of Digital Posters.


If You Want to Make an Infographic, Don’t Make a Digital Poster

You might still be confused by the revelation that not all things posing as Infographics are in fact genuine, but if it’s your job to create one, here are a few things to keep in mind:


Add Context

One of the most important things an Infographic can do is add context. Consider this example:
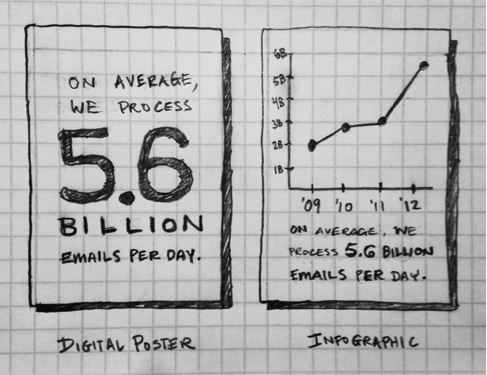
The illustration on the left represents the way this information would be presented in a Digital Poster. The illustration on the right shows the same information as an Infographic. Both of these start the same information, but the Infographic allows the viewer to glean a deeper understanding through the addition of context.  A good example of a Digital Poster posing as an infographic can be seen here: http://think.withgoogle.com/databoard/


Expand Context Through the Use of Metaphors

Infographics can (and should) be enhanced through the use of metaphor.

Being stuck with a single number to display is maddening. How do you show size? What does its size even mean? This dilemma is an opportunity to add context and metaphor. By comparing a number to something else that is familiar, you create understanding. 

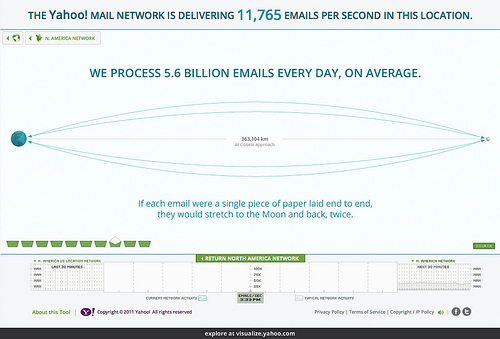
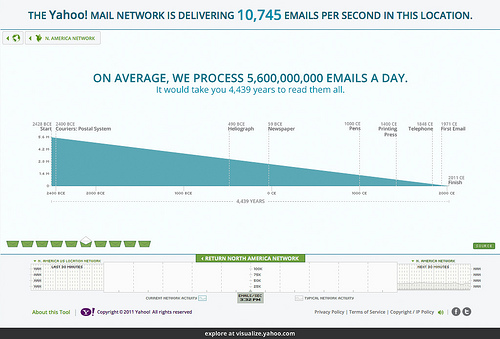
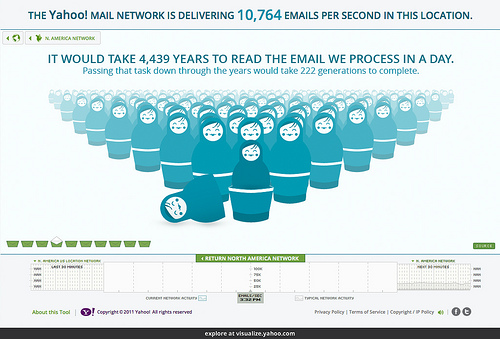
Here are some examples of adding context to the previous graphic:
http://www.flickr.com/photos/periscopic/6352095776/in/set-72157629247990061
 

http://www.flickr.com/photos/periscopic/6351350561/in/set-72157629247990061
 

http://www.flickr.com/photos/periscopic/6351350295/in/set-72157629247990061


Keep in mind that the context should match the subject matter. The examples provided above concern emails – or correspondence – and the metaphor will be most effective when it extends the topic. Making a comparison to a page of text and the time spent reading it are easy leaps of imagination because the viewer’s mind is already considering the concept of communication. If we had instead compared that number to the blades of grass in a field, the size of the field might end up being pretty large, but the goal of getting the viewer to imagine the scale of the emails requires a larger cognitive leap, and provides less impact. 

By adding metaphor to data we add dimension. Through this abstraction we gain the ability to provide complex information in a way that is accessible to a much wider audience than that which might be familiar with the specific subject matter. In addition, metaphors not only provide an easy vehicle for empathy and comprehension, they are also an excellent opportunity to add visual interest.


Respect the Data

Data collectors are the historians of our time. The data revolution that started with affordable large storage devices is capturing our history in the finest detail we have ever known. The process of collecting it, specifically when it is done by real people, is difficult and tedious, and largely goes unnoticed. When you visualize data, you must respect what you have, and the enormous potential it represents. Even the simplest statistic deserves more than a passing thought, or an effortless grasp at the most obvious visual display that comes to mind.


Do More

When creating an Infographic, the data you present must do more as a graphic than if it were presented as a number or single line of text. Adjusting the size of your text, illustrating a word found within the text, or even showing the concept embraced by a cute illustration is not enough. If you believe the data has a story to tell, then you should do your best to tell it.


Know Your Options 

Working with data is nuanced and requires an understanding of the appropriate types of data display. A single data set, or statistic, can potentially have multiple ways of being visualized. In the same manner, a single data presentation method can be used to display multiple types of data. Understanding the relationship between your data and your data presentation options is essential if you want to create effective Infographics.


Strive for Elegance and Clarity

A natural tendency is to want to include every datapoint on the screen, assuming that more data will equate to more credibility. This is logical in spirit, but counterproductive in practice. Data design follows the same rules as visual design. Remove anything you can’t justify and isn’t relevant to the message you’re trying to convey. The empty spaces, the things you leave out, can provide clarity – and can also provide an opportunity to evoke questions in the viewer’s mind (that’s a good thing). 
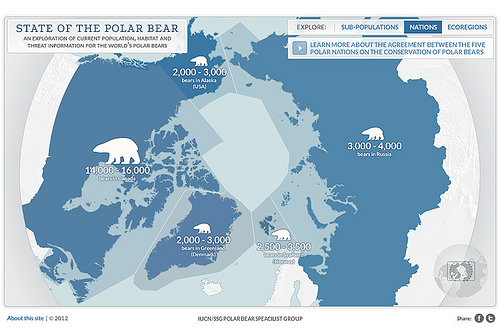
http://www.flickr.com/photos/periscopic/8004311938/in/set-72157631576836704


Use Emotion

The best way to connect with people is to elicit an emotional response. No matter what the subject matter, visualizers need to have empathy for how people will feel when they reflect on the data we’re presenting. Sock, joy, sorrow, curiosity, and other strong emotional reactions likely illustrate that you’ve chosen an important dataset and are presenting it well. In many ways, the ultimate compliment an Infographic creator can receive is to know that a viewer of their work is being moved at a level that goes deeper than just an intellectual response. 
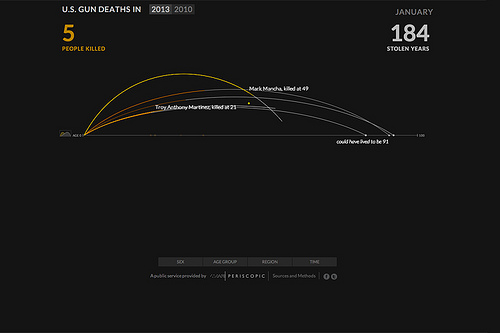
http://www.flickr.com/photos/periscopic/8601076022/in/set-72157633115411317


Be Authentic and Sincere

Presenting datapoints without consideration for what they represent shows a lack of empathy. When you visualize data, it is essential to understand the role it plays in the larger social conversation. If it has the potential to change a person’s worldview, you need to do whatever you can to make this happen. Divorcing yourself from this responsibility is the sign of on uninspired designer. Imagine you are actually having a conversation with the viewer. Let your design choices begin a dialog.
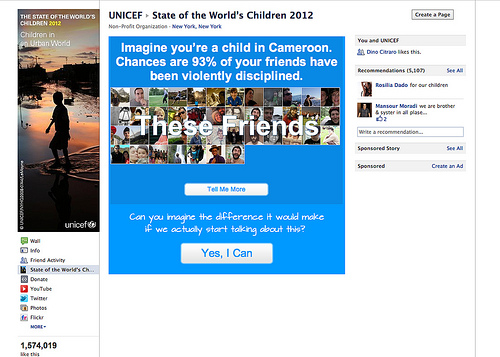
http://www.flickr.com/photos/periscopic/6792935314/


Know the Difference

Data is easy to love. It represents truth and clarity, and can inspire people to grab whatever living thing is nearest to them and insist it listen. It can move a person to join a protest, to shout a slogan, or even inspire someone to make a poster. Even a digital one.

When we begin to discern between graphical representations of data and actual visualizations of data, we become better data consumers and better knowledge creators. There is a place for Digital Posters, it’s just not the same place as Infographics.


Kim Rees

Partner & Head of Data Visualization (@krees)

Kim Rees is Head of Information Visualization at Periscopic, and is a prominent individual in the data visualization community. She has presented at several industry events including Strata, OSCON, Wolfram Data Summit, VisWeek, Tableau User Conference, NY Hacks/Hackers, and Portland Data Visualization among others.

She is an advisor to the US Congressional Budget Office. Kim has published papers in Parsons Journal of Information 

Mapping, was an award winner in the VAST 2010 Challenge, and is a guest blogger for Infosthetics and FlowingData.

Recently, she was the Technical Editor of Visualize This, by Nathan Yau of FlowingData. She was a judge on the WikiViz Challenge 2011 and CommArts Interactive Annual 2012.


Dino Citraro

Partner & Head of Strategy (@dinocitraro)

Dino Citraro is Head of Strategic Design and Operations at Periscopic, and has a strong background in problem solving, creative direction, and writing. 

A twenty-year veteran of the multimedia industry, his work has spanned immersive online development, application design, interactive motion pictures, multi-player games, and interactive hardware installations.

He is the Visualization Editor of the Big Data journal, as well as a contributing blogger to several industry sites. He is also an accomplished photographer, a published poet, and has written & illustrated seven children’s books.

Monday
Jul152013

The Investfographic

Investfographic

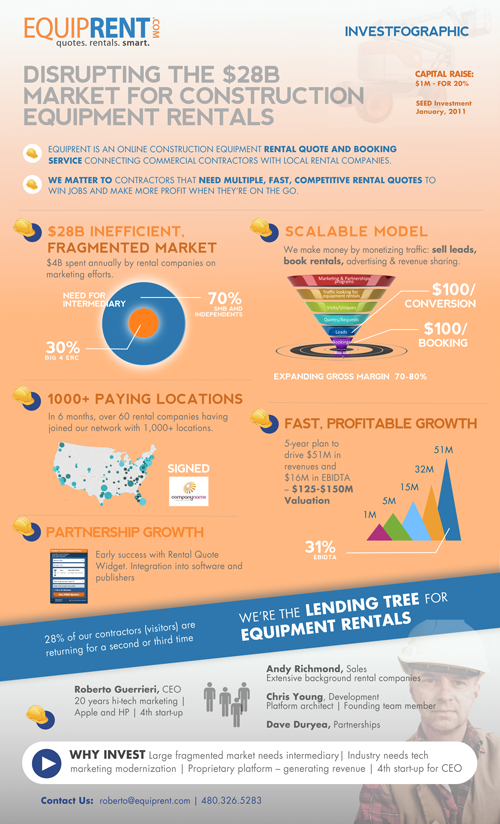
The Investfographic from EquipRent.com is the infographic they designed in-house to share with potential investors. Visual aids and infographics are becoming a valuable tool for companies to communicate with potential investors and shareholders.  Consider this to be a visual elevator pitch.

Using an “InvestFoGraphic” to raise capital

As a serial entrepreneur, I am always looking for an edge that makes a company standout and be noticed during capital raising times.

With the advent of new software tools like Prezi to boost your presentations, we decided to creatively put together a colorful investment infographic handout that completely complied with our goal of keeping our story concise, relevant, and exciting. The typical handout (1-page executive summary) that we had previously given VCs was heavy on words explaining in great detail what our company did and how successful we had been. This new graphic handout was riddled with bold and exciting claims about our company and our industry. The underlying theory behind using the infographic was to hook them first, grab their attention and then be ready to talk business. 

The exciting news is that we are now in final discussions with several investor groups to close our funding. We know the infographic wasn’t the main reason for getting to this final phase, but we do know that differentiating yourself makes you more memorable and shows investors you and your company plan on being different than the massess.

Remember the advice that the great Rod Stewart gave years ago:  Every picture tells a story, don’t it!

The team at EquipRent uses the design as a talking point at investor events.  They found it much easier to point out the visuals and discuss each point with their investors.  They shared with Cool Infographics, a few of the comments made by investors after seeing the design:

  • “I can quickly see what is different about this company than reading a typical one-page executive summary.”
  • “I have never seen anyone use an infographic for investor purposes,  other than to distinguish market trends.”
  • “Definitely sets you a part…like a cool and different resume.”

Thanks to Nate for sending in the link!

Friday
Jul122013

Battle of the (Social) Sexes

Battle of the (Social) Sexes infographic

The Battle of the (Social) Sexes infographic from InternetServiceProviders.org explores some of the demographic data behind social media.

You’ve no doubt heard the old, oft-quoted adage, “men are from Mars, women are from Venus,” used to denote the fact that men and women may not always see completely eye to eye. While this light-hearted statement isn’t taken literally, when it comes to the virtual world of Internet interactions, similar sentiments may be formed surrounding the different ways men and women use social networking. While the majority of adults in the US are plugged into some sort of social media outlet, not all of them are used in equal measure, and not all of them are used by both genders equally. For instance, the average Google+ user spend just three minutes per month on the network, while the average Facebook user will spend 405 minutes per month updating statuses, posting pictures, and checking out others’ profiles. So what can be learned about men and women in the world of the web? As is turns out, men and women tend to dominate very different social media networks. The following infographic takes a look at some of the differences between male and female-dominated social media sites: How many users each one has, as well as how they interact.

There’s so really good data they have compiled in here, and most of the data visualizations are easy to understand.  I would not have expected to see that Twitter has 40 million more female users each month.

There are a handful of minor tweaks that would help improve the design:

  • The salmon/orange/peach color for women is unexpected compared to the traditional pink.
  • Go ahead and use the official Twitter and Facebook icons.  No need to design their own.
  • The pie slices for time spent would work much better with colors that are more distinct.  The different shades of gray are very hard to differentiate.
  • For the pie charts, the text label should be placed next to the pie slice its describing, instead of the opposite side as shown in this design.  Flipping the pie charts horizontally would fix that easily.

I appreciate the clear Creative Commons license in the footer, but the URL to the original infographic lansing page is missing.  Since the infographic image file is shared by itself, the URL always helps readers to find the original.

Found on Ragan’s PR Daily