About
Randy Krum
President of InfoNewt.
Data Visualization and Infographic Design

Infographic Design

Infographics Design | Presentations
Consulting | Data Visualizations

DFW DataViz Meetup

Join the DFW Data Visualization and Infographics Meetup Group if you're in the Dallas/Fort Worth area!

Search the Cool Infographics site

Custom Search

Subscriptions:


Feedburner

The Cool Infographics® Gallery:

How to add the
Cool Infographics button to your:

Cool Infographics iOS icon

- iPhone
- iPad
- iPod Touch


Read on Flipboard for iPad and iPhone

Featured in the Tech & Science category

Flipboard icon

Twitter Feed
From the Bookstore

Caffeine Poster

The Caffeine Poster infographic

Entries by Randy (1654)

Monday
Nov072016

Visual History of US Population

Nathan Yau from FlowingData has created a cool, new animated data visualization, Two Centuries of Population, Animated. The visualization shows the growth and spread of 

You’ve likely seen the population density map of the United States in one form or another. A lot of people per square mile reside in big cities, fewer people reside in suburban areas, and a lot fewer people reside in rural areas. Cities weren’t always cities though. Rural wasn’t always rural. If you look at people per square mile over a couple of centuries, you get a better idea of how the country developed.

The animated map above shows population density by decade, going back to 1790 and up to recent estimates for 2015. The time in between each time period represents a smoothed transition. This is approximate, but it gives a better idea of how the distribution of population changed.

Nerd Notes:


  • Nathan used R to generate the maps and FFmpeg to string the images into a video.
  • Data are originally from the Census Bureau but made much more accessible by NHGIS.


Thursday
Oct272016

9 Great DataViz & Infographics Tools with Education Discounts

Data visualization and data literacy are necessary life skills, and you should start developing them now! Whether you need to make a diagram for a Science project, a presentation for your History class, or a chart to solve that Math problem, you should start learning how to use data visualization tools while you’re in school. These tools are being used in classrooms from elementary school up through colleges and universities. While many online design tools offer free trials, these tools offer exclusive educational prices for students, teachers and educators to give them the means to more easily visualize information at a great price.

Here I share some of today’s most popular online data visualization and infographic tools, all offering educational prices. Because these are all online tools, they are all cross-platform, making them great for any computer a student may have; Windows, Mac or Linux. Follow the links to find the current education pricing deals!

I love that all of these online tools are helping to improve data literacy for students and educators all over the world! Which are you favorites? Any more online tools with education pricing plans for students and teachers that I missed?
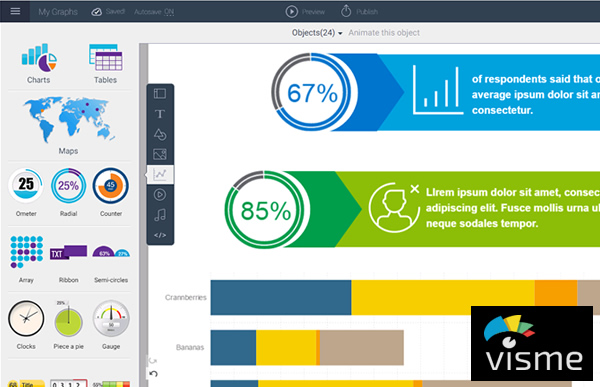

Visme

Visme is an online tool used to visually present your ideas in the form of infographics, presentations, reports, and much more. Visme has a built-in charting tool gives you the power to easily transform your data into visual content and with their easy-to-use editor. Hundreds of fonts, millions of free images, and thousands of quality icons for use in your designs. Share your designs online with a direct link, post on social media, embed on a website, or download for offline use.

Contact for educational pricing: http://support.visme.co/
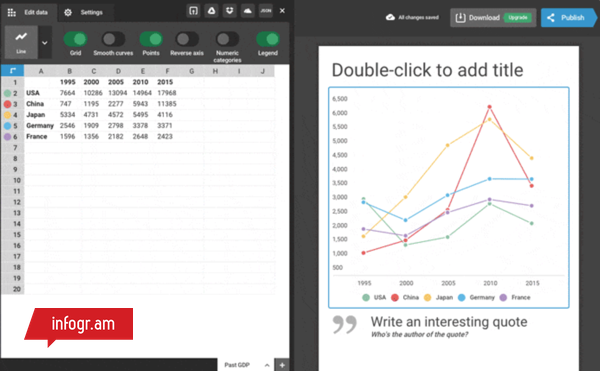


Infogram Education Pricing

Infogr.am

With Infogr.am, you have the power to make your data look its best. Users can easily create interactive charts and graphics that require zero coding. And to make sure your data is always up-to-date, you have the option to connect your chart to live sources like Google Sheets a Dropbox file, or a JSON feed. Educators can create a team account for an entire class.

Contact for educational pricing: https://infogr.am/education
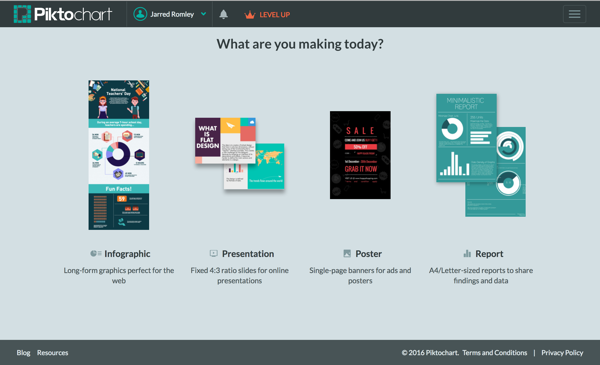


Piktochart Education Pricing

Piktochart

Take your visual communication to the next level with Piktochart, an easy-to-use infographic maker. Create your charts by importing your data from a Microsoft Excel file or a Google spreadsheet. With a library of hundreds of professionally-designed templates, creating infographics, reports, posters, and presentations has never been easier. Educational pricing for individuals or whole classrooms.

Individual and classroom prices: https://piktochart.com/pricing/education/
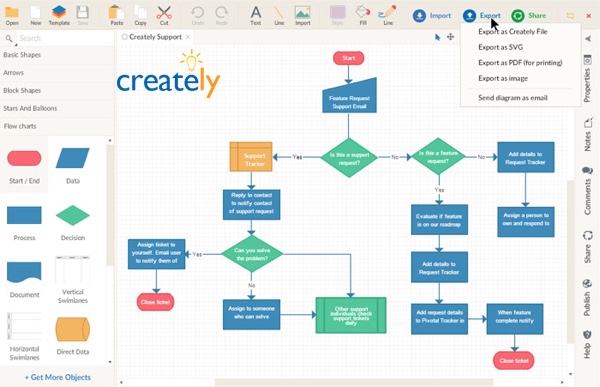


Creately Education Pricing

Creately

With Creately, you can easily make beautiful diagrams in no time. Flow charts, mind maps, organization charts, Venn diagrams, Gantt charts, network diagrams and more. Thousands of ready-made subject-specific templates and over 40 types of diagrams with specialized shape sets are available to make sure your diagram looks its best. And real-time online collaboration allows you to work with fellow students.

Contact for educational pricing: http://creately.com/diagram-products#education
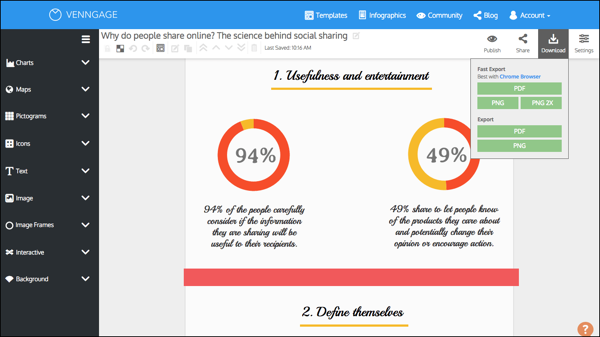


Venngage Education Pricing

Venngage

Venngage allows users to create infographics in just three easy steps: choose a template, add charts and visuals, and customize your design. In just minutes you can create a visual story in the form of posters, social media posts, and infographics. Post your final designs on social media, embed on websites, or download as an image or PDF file.

Register for a classroom Education account, includes 35 users: https://venngage.com/education-pricing/
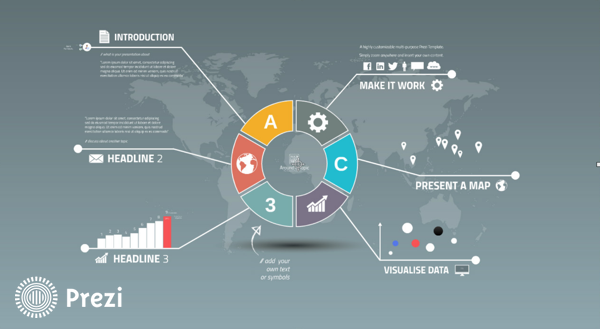


Prezi Education Pricing

Prezi

Prezi is the tool for creating engaging and memorable presentations with the charting tool, editable images, and embedded videos. Give your presentations online or offline, using the library of templates as your starting point. Prezi presentations are built on an open canvas and spatial movement transitions that are unique and easy-to-use.  

Choose an educational pricing package: https://prezi.com/pricing/edu/
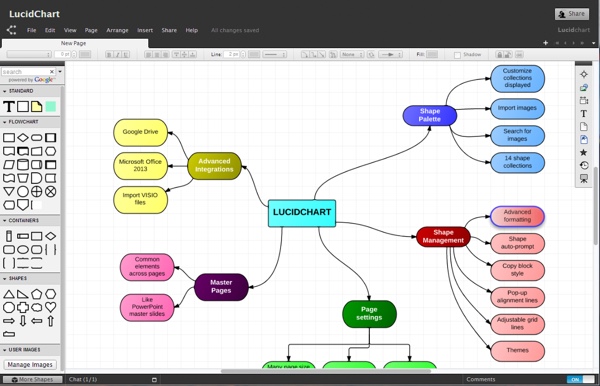


Lucidchart Education Pricing

Lucidchart

Lucidchart is an online diagramming tool for everyone. You  can create flow charts, Venn diagrams, mobile app mockups, network diagrams and more using the extensive shape libraries, or perform a Google image search right in the editor. You can even add a YouTube video to your diagram!

FREE accounts for students and teachers: https://www.lucidchart.com/pages/usecase/education
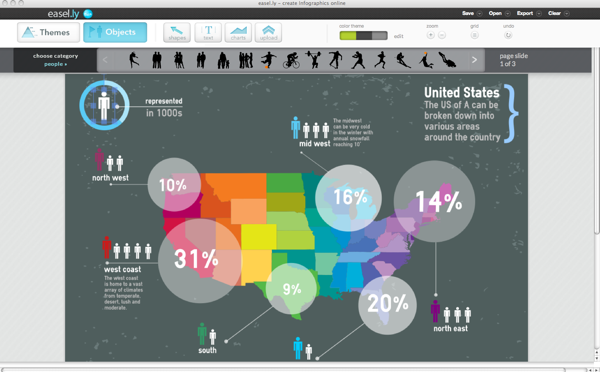


Easelly Education Pricing

Easel.ly

With over thousands of infographic templates to chose from, Easel.ly makes creating and sharing your visual ideas easy. The drag-and-drop interface helped Easel.ly win the Best Websites for Teaching and Learning Award from the American Association of School Librarians (AASL) in 2013. Create your infographic, and then publish online or download a high-resolution file for offline use. Check out their free ebook: How to Use Easel.ly in your Classroom (https://www.easel.ly/blog/infographicsforeducation)

Contact for educational pricing: https://www.easel.ly/contactus
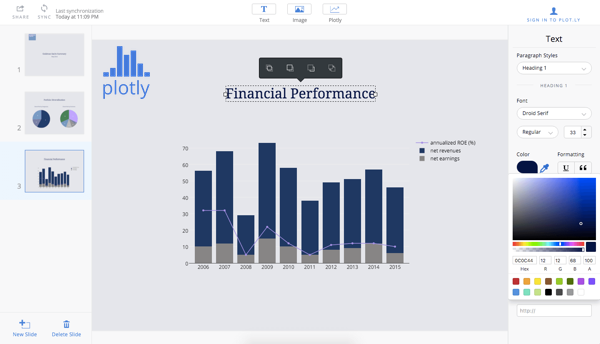


Plotly Education Pricing

Plot.ly

Plot.ly is a higher-level, advanced data visualization platform that helps data science, engineering, and analytics students create create informative graphics using an open source visualization library and an online chart creation tool. With Plotly, users can easily import data, create charts, and share their findings by embedding them on a website, exporting them, or creating presentations and dashboards. Create technical visuals using tools and APIs for D3.js, Python, R, MATLAB, Excel and more.

Student pricing for Professional features: http://marketing.plot.ly/education.html


Article was reposted by The Huffington Post

Tuesday
Oct252016

Earth's Temperature Timeline

A Timeline of Earth's Average Temperature infographic

A Timeline of Earth's Average Temperature is another great data visualization design by Randall Monroe at XKCD.com! Real data and a humorous take on historical events!

A Timeline of Earth's Average Temperature since the last ice age glaciation. When people say "The climate has changed before," these are the kinds of changes they're talking about.

It's a long design on purpose. That's what drives the context of the data so strongly. 22,000 years of small changes and major historical events and then "Oh shoot..."

Found on FlowingData

Thursday
Oct202016

Electrocardiography Basics

Electrocardiography Basics infographic science illustration poster

Electrocardiography Basics is a new infographic science illustration poster design by Eleanor Lutz at TabletopWhale.com for Nerdcore Medical. You can purchase the printed poster for $19.99 from Nerdcore Medical.

This week’s collaboration with Nerdcore Medical was a fun chance to try a more simple style than I usually use. For this poster I wanted to show 11 different kinds of heartbeat EKGs in a colorful design.

I wanted to highlight the unique shapes of each EKG wave as the focal point of the poster. After trying a few different things, I decided to try and make a digital heartbeat “sunrise,” where each of the EKG waves defined a specific colorful section of the poster. I thought it would show off the simple shape of the waves, and also work as a practical way to section off the different descriptions.

I ended up designing each line in Illustrator, and then importing the shapes to Photoshop to add textured shadows, color overlays, and text. More... 

Eleanor followed up this design with a behind-the-scenes blog Rough Drafts and Sketches post about what went into her design process, and specifically the color palette selection process (a beautiful infographic design itself!).


Friday
Oct142016

A House Divided: The Rise of Political Partisanship

The Rise of Partisanship in the House of Representatives is a video infographic showing network maps and animating their change over time. Business Insider published this great data visualization video earlier this year.


This 60-second animation shows how divided Congress has become over the last 60 years

It's news to no one that Congress has had a hard time passing legislation in recent years. Some have even asserted that partisanship in Washington has reached historic levels. But how do we put the current divide in perspective? A group of researchers recently tried to quantify and visualize House partisanship in a paper published in PLoS ONE.

Produced by Alex Kuzoian. Original visualization by Mauro Martino.

To understand what is being displayed:

  • Each dot represents a member of the U.S. House of Representatives
  • Connection lines represent when two members voted the same way
  • Connection line thickness represents how often they voted together during each 2-year period
  • Dot size based on the total number of connections
  • Color represents political party

A poster version of this design is also available on Mauro Martino's site:

Thanks to Sue Miller for sharing on Facebook!

Wednesday
Oct122016

How Much Warmer Was Your City in 2015?

How Much Warmer Was Your City in 2015

This is a cool interactive data visualization from the NY Times: How Much Warmer Was Your City in 2015?

Scientists declared that 2015 was Earth’s hottest year on record. In a database of 3,116 cities provided by AccuWeather, about 90 percent of them were warmer than normal. Enter your city in the field below to see how much warmer it was last year.

Temperature and precipitation data are provided by AccuWeather. The normal range of temperature is calculated by normalizing the weather from 1981 to 2010.

Data for some cities are incomplete. When actual or historical temperatures were missing, the corresponding bar is not shown for that day. The data presented here are as they were recorded on Jan. 22, 2016.

By K.K. Rebecca Lai, with additional work by Gregor Aisch

You can choose your city (or a city close to you) from the 3,116 cities included in the data. For many cities, you will see the 2015 daily temperature ranges in comparison to the normal temperature range and the historical high and low record temperatures. If historical data is not available, you will only see the comparison to the normal temperature range.


Monday
Oct102016

5 Great TED Talks about DataViz

DataViz is a broad term that has been trending for years, so what exactly is DataViz, and why does it matter? DataViz (or data visualization) is simply the visual representation of data or information. For example, charts, maps, diagrams, infographics, icons and illustrations are all forms of data visualization. It is commonly understood that humans are visual creatures. We understand visual information faster than reading text, and we are more likely to remember visual information later when it can impact a decision or behavior. As the amount of data we generate continues to increase, we need more efficient ways to understand and communicate insights from the data, and this is where DataViz is very effective.

The world is changing, and the world of DataViz is changing. In this ever evolving world, one thing is constant, TED’s ability to understand the pulse of what’s next. This is no more apparent than when TED talk influencers focus on the world of dataviz. From DataViz guru David McCandles talk on The Beauty of Visualization to medical doctor and statistician Hans Rosling talk on The Best Stats You’ve Ever Seen, you can experience the depth and breadth in the world of DataViz.


David McCandless - The Beauty of Visualization

“Design is about solving problems and providing elegant solutions, and information design is about solving information problems.”

McCandless' repertoire of visualized data has ranged from politics and climate to pop music trends. But it’s not the actual graphics that present McCandless’ true brilliance. Rather, it’s his ability to discover new ways to combine data in a fresh and interesting way. In his TED Talk, he discusses his process of turning complex data into simple yet engaging graphics.

TED Talk: http://www.ted.com/talks/david_mccandless_the_beauty_of_data_visualization


Chris Jordan -  Turning Powerful Stats into Art

“That's what I'm trying to do with my work, is to take these numbers… and to translate them into a more universal visual language, that can be felt. Because my belief is, if we can feel these issues… then they'll matter to us more than they do now.”

Artist and photographer Chris Jordan has a passion for American consumption. He strives for unique visualizations of some of Western culture’s most unimaginable statistics, solidifying the phrase, “a picture is worth a thousand words.” In his speech, Jordan invites the audience into the inspiration and process behind some of his best work- including his powerful visualization of America’s annual incarceration rate.

TED Talk: https://www.ted.com/talks/chris_jordan_pictures_some_shocking_stats


Aaron Koblin - Visualizing Ourselves… With Crowd-Sourced Data

“Our lives are being driven by data, and the presentation of that data is an opportunity for us to make some amazing interfaces that tell great stories.”

From Johnny Cash’s final music video to animating the paths of every North American airline flight, Aaron Koblin’s work is all about fun. As more and more social data becomes available, Koblin discusses how he feels it’s his obligation to tell stories through visualizations. Standing by his belief that data makes us more human, Koblin shares how interface can be used as a powerful narrative device.

TED Talk: https://www.ted.com/talks/aaron_koblin 


Hans Rosling - The Best Stats You’ve Ever Seen

“We want to see how the world is changing. Why are we not using the data we have? Because the data is hidden down in the databases. And the public is there, and the Internet is there, but we have still not used it effectively.”

It’s guaranteed that you've never seen data presented like Hans Rosling presents it. His genius stems from his ability to transform development statistics into animations that make the information clear, intuitive, and playful. In this legendary TED Talk (the first of many TED Talks he has given), Rosling discusses the idea that making information more accessible has the potential to change the quality of the information itself.

TED Talk: https://www.ted.com/talks/hans_rosling_shows_the_best_stats_you_ve_ever_seen   


Jer Thorp - Make Data More Human

“I believe that this world of data is going to be transformative for society… By bringing the human element into this story, I think we can take it to tremendous places.”

Deeply inspired by science, Jer Thorp creates beautiful data visualizations to put abstract data into a human context. At TEDxVancouver, he shares some of his finest work, and delves deeper into why his art focuses on bringing big sets of data to life.

TED Talk: https://www.ted.com/talks/jer_thorp_make_data_more_human

Thursday
Oct062016

7 Times Technology Almost Destroyed The World

7 Times Technology Almost Destroyed The World infographic

7 Times Technology Almost Destroyed The World is a scary infographic from Hudman.

The importance of thoroughly testing new technology is highlighted in this infographic. We take a light-hearted, yet terrifying look at how close the human race has come to destroying all life on planet earth.

Fun, engaging information! From a design perspective, there's way too much text in this infographic, and the font size is too small to easily read. So much text, it will probably turn away many readers before they read any of the information.

Simplify, simplify, simplify! Shorter descriptions and larger icons or illustrations will draw in readers to engage with the infographic.

Wednesday
Oct052016

The Top Colors of the Internet

The Top Colors of the Internet

Paul Hebert has done the research and visualized the Colors Used by the Ten Most Popular Sites on the Internet. You can see the fan chart above with changing background color that reveals some of the hidden colors.

The Internet is primarily blue!

Paul Hebert:

I was curious what colors were being used by large, popular sites, so I decided to find out.

By displaying the colors used in popular sites in a variety of ways we can glean interesting conclusions about modern trends in web design. Organizing the colors by hue, saturation and value provides viewers with a variety of different ways to view the data. Instead of forcing conclusions upon the user this visualization provides them with the information they need to draw their own insights. I scraped the data using PHP, then built the page using PHP, HTML, SCSS, and Javascript.

This data is current as of September 18th, 2016.

Although I've tried to make this site as accurate as possible there are some known issues which have not yet been resolved.
  1. Colors in images are not included.
  2. Some colors in stylesheets aren't actually used on the sites.
  3. Colors added by external javascript are not included.

All of the visualizations on the original site are interactive with pop-up information on the actual color, but you can see a few of the other static visualizations here.


Found on this great write-up by Wired

Thursday
Sep292016

Visualizing the Fortune 500

Visualizing the Fortune 500 interactive data visualization

Visualizing the Fortune 500 is an experiment by the team at Fortune magazine. This is an interactive data visualization site that shows the location of each company's headquarters and the size of the circle represents the company's annual revenue.

People visit and revisit the Fortune 500 for lots of reasons, chief among them: job prospects, sales leads, corporate research and investor information. And bragging rights, of course. Below are two visualizations that allow you to explore the Fortune 500. On the map you'll find every one of the U.S. headquarters from the 2016 list, on the line chart below it, you'll see how each of the companies on the 2016 list has moved through the ranks for the past 20 years.

They also show an interactive visualization of how the companies have moved through the ranks over the last 20 year history of the Fortune 500.

Designed by Nicolas Rapp, using map tiles from Stamen Design.