About
Randy Krum
President of InfoNewt.
Data Visualization and Infographic Design

Infographic Design

Infographics Design | Presentations
Consulting | Data Visualizations

DFW DataViz Meetup

Join the DFW Data Visualization and Infographics Meetup Group if you're in the Dallas/Fort Worth area!

Search the Cool Infographics site

Custom Search

Subscriptions:


Feedburner

The Cool Infographics® Gallery:

How to add the
Cool Infographics button to your:

Cool Infographics iOS icon

- iPhone
- iPad
- iPod Touch


Read on Flipboard for iPad and iPhone

Featured in the Tech & Science category

Flipboard icon

Twitter Feed
From the Bookstore

Caffeine Poster

The Caffeine Poster infographic

Entries in map (184)

Thursday
Aug182011

The Power of Data Visualization: iPhone Tracking

Inofrmation is power.  Data visualization has the power to change the world!  Change our habits, our laws, our business strategies and what we understand about the world around us.  Our understanding of data forms the foundation of how we make choices, form opinions, and at least one study claims that up to 80% of the human brain is wired just to interpret and remember visual data.

Anyone reading this blog has a basic understanding that data visualization makes things easier to understand.  It puts data into context and allows the viewer to see large data sets summarized in a much smaller space.  I’ve avoided updating to the latest iOS on my iPhone until I could put together this post since it’s such a great example of how visualizing data turns it into information that people can use.

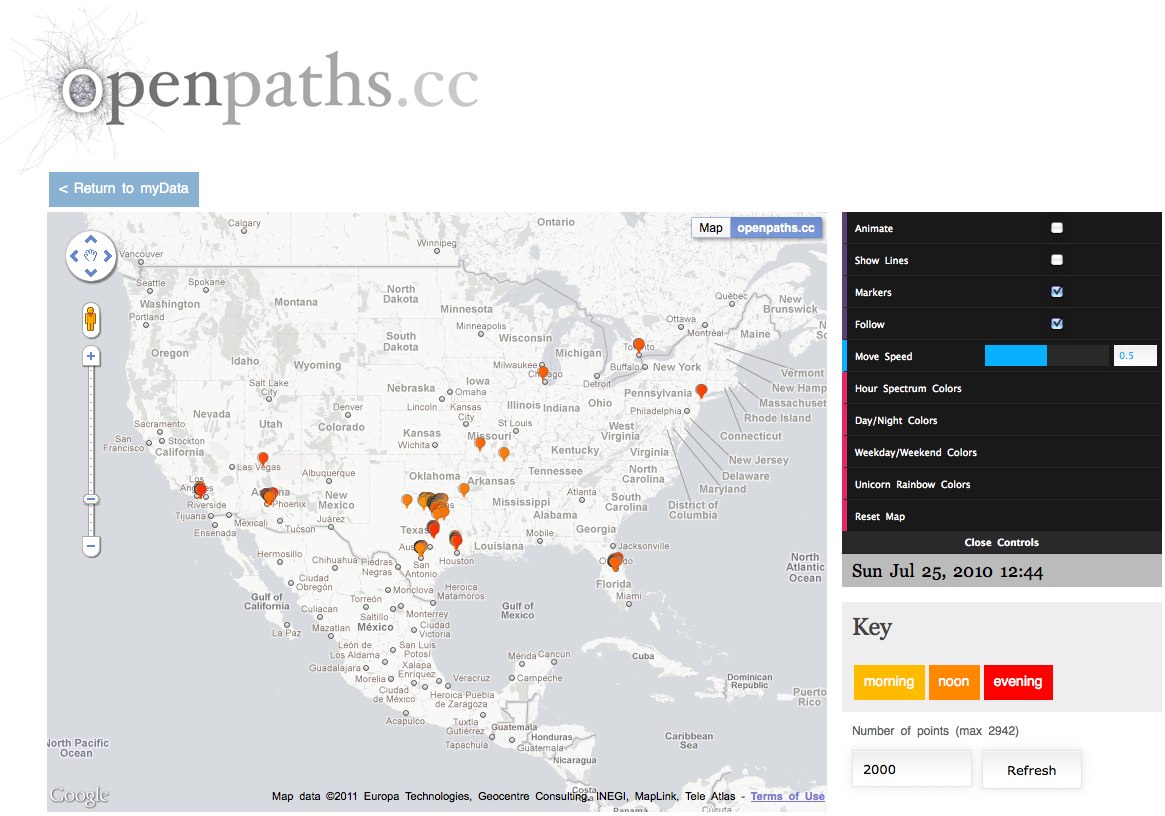
Earlier this year, Alasdair Allan and Pete Warden announced at the Where 2.0 conference that Apple’s iPhones were tracking all of your location data in an open, accessbile file on your computer.  ALL of the location data since the phone was first turned on, which could be years of data.  Heavily covered by the press, you can see their announcement here.  The reason I bring this up on Cool Infographics, is that I believe the visualization itself is what caused this to become a major media event sometimes referred to as “Locationgate.”

Some industry and forensic experts knew about this data already, and many others had tried to to make the public aware of it without any success.  Just telling people that your cell phone is storing location data doesn’t make it real and personal enogh to get the press and the public to care.  In fact, there have been other stories that Google’s Android and Microsoft’s Windows Phone 7 also gather this tracking data, but only Apple’s data was turned into a visualization and captured attention.

Alasdair and Pete wrote a simple application that anyone could download and use to see their own location data visualized on a map.  This not only made the story more understandable but it made it personal because I could see my own data.

We’d been discussing doing a visualization of mobile data, and while he was researching into what was available, Alasdair discovered this file. At first we weren’t sure how much data was there, but after we dug further and visualized the extracted data, it became clear that there was a scary amount of detail on our movements. It also became obvious that at least some other people knew about it, but it wasn’t being publicized.

iPhoneTracker is an open-source project that visualizes the location data that your iOS device is recording.

Created by Alasdair Allan and Pete Warden using the OpenStreetMap and OpenHeatMap frameworks.


As you can see above, they were even nice with data, and aggregated it into a simple grid that isn’t the actual GPS locations or location of the cell towers.  (This shows my trip to DisneyWorld in Florida)  The size of the circles shows the frequency of data points within that specific location.  So the visual shows an approximate location, but the actual data file on the iPhone was much more detailed.  Of course, the application was open source, so others started playing with the code and created much more detailed versions of the software.  Here’s that same data using the Creepy Edition of iPhoneTracker:


I believe that this use of data visualization to communicate the story was the primary factor that caused a media furor, lawsuits, press releases, interviews, government hearings and proposals to change our laws.

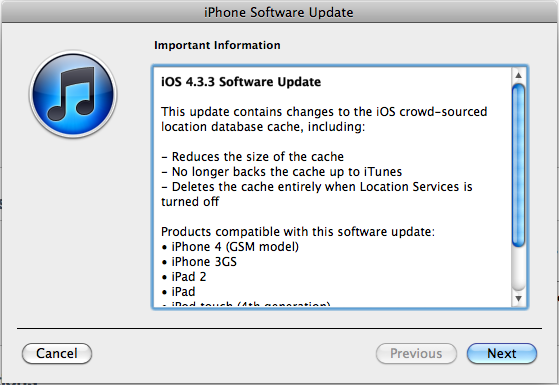
Apple posted an official press release responding to all of the attention and released a software update that deletes most of the historical data.  Sadly, the next time I update my iPhone, the historical data will all be erased.  Personally, I wish I had the option to continue to gather my own data because I’m into this sort of thing.  This file is now also encrypted if you turn on “Encrypt iPhone Backup” so it’s no longer easily accessible.
 

What’s the point?  Data visualization can be used to make your information relevant to your audience and get their attention.  Don’t just tell people your story, show them.


Tuesday
Jun212011

Foursquare Reaches 10 Million Users


Foursquare yesterday announced that they have reached 10 Million members, and released this infographic for the occasion.

And, to commemorate this pretty crazy occasion, we put together a little infographic. Be sure to click through to see it bigger; if you’re anything like us, watching the full-size animated map puts butterflies in your tummy. Thank you so much for supporting us!

I love the animated portion right in the middle!

Personally, I have mostly given up on Foursquare check-ins without the points or mayorships earning anything for me.  I wonder how many of those 10 Miliion joined, but don’t use Foursquare anymore?

Wednesday
May182011

Microsoft Acquisitions Subway Map #infographic

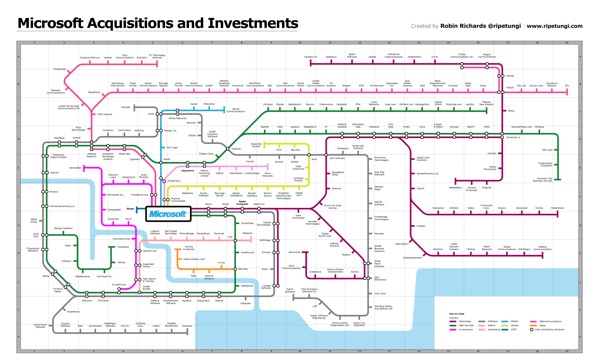
Robin Richards (@ripetungi) recently updated his fantastically detailed subway map of Microsoft Acuisitions and Investments.  Although Robin is the Information Design Director at JESS3, this is one of his personal projects.

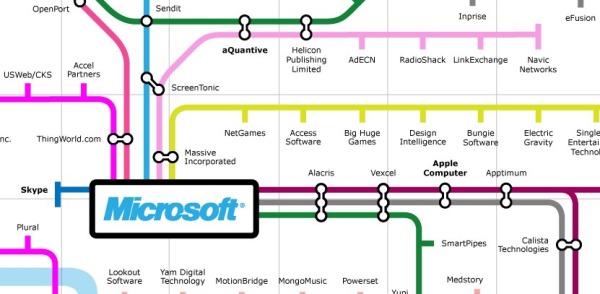
Infographic showing the acquisitions and investments of Microsoft, done as a tube map with each coloured line representing a different industry for each acquisition or investment.  Where the stations meet is where the two industries overlap.  The key at the bottom displays information about the location on the map of the station (company) the year of acquisition or investment.


This thing is big!  Poster-sized big.  I dropped the link into Zoom.it so it would be easier for you to zoom in closer and see the details.


Great job Robin!  I love this project.

Thursday
Apr072011

The Map of the Internet

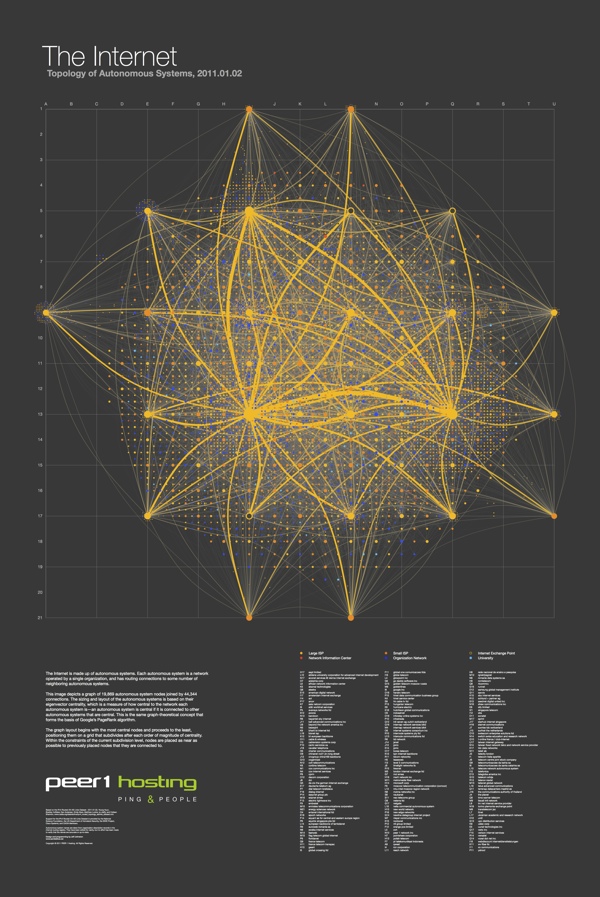
The Map of the Internet is an ambitious project from Peer 1 Hosting that maps the network of hosts and routing connections that are the foundation of the Internet.  Clicking on the image above takes you to the poster in an interactive zooming viewer so you can see the details.  You can also read about the making of the poster in this post on the Peer 1 Hosting blog.

It’s a layout of all the networks that are interconnected to form the internet. Some are run by small and large ISPs, university networks, and customer networks - such as Facebook and Google. It’s visual representation of all those networks interconnecting with one another, forming the internet as we know it. Based on the size of the nodes and the thickness of the lines, it speaks to the size of those particular providers and the connections. 

In technical speak, you’re looking at all the autonomous systems that make up the internet. Each autonomous system is a network operated by a single organization, and has routing connections to some number of neighbouring autonomous systems. The image depicts a graph of 19,869 autonomous system nodes, joined by 44,344 connections. The sizing and layout of the autonomous systems is based on their eigenvector centrality, which is a measure of how central to the network each autonomous system is: an autonomous system is central if it is connected to other autonomous systems that are central.

My apologies for being late posting this one here on the blog.  They were giving out free printed 24”x36” posters at SxSW in Austin, TX a couple weeks ago, but the high-resolution PDF is available from the Peer 1 Hosting site.

Thanks to Shobhita for sending me the information and the link!

Tuesday
Feb082011

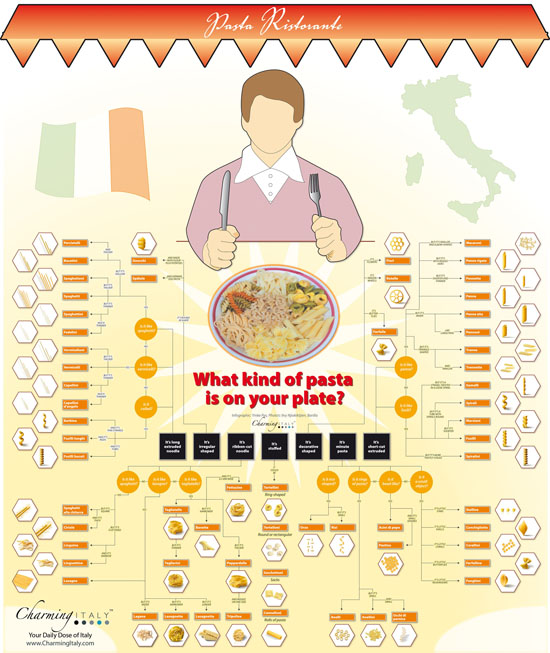
What Kind of Pasta is on Your Plate? #infographic

What kind of pasta is on my plate?
What kind of pasta is on your plate? by Charming Italy

Came across this great family tree/decision tree to help you identify the different kinds of pasta from CharmingItaly.com.  What Kind of Pasta is on Your Plate? breaks the pasta types down into shape families and uses some nice visuals to help you identify your pasta.

I’m an avid reader of Coolinfographics.com - some of the infographics you mentioned on your blog inspired me to create one for our blog as well. Unlike the usual chart- and fact filled graphics, we decided to create a somewhat educational infographic. It highlights the most common and/ or popular types of pasta, and helps you to identify the type of pasta on your plate.

I wish they would hang this up in the pasta aisle in the grocery store!

Thanks to Paolo for sending in the link!

Friday
Jan282011

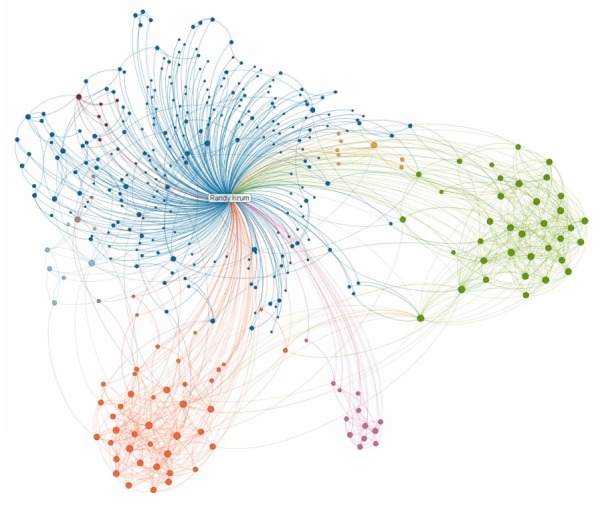
InMaps: Viewing Your Business Network

The new LinkedIN Maps is a very cool interactive infographic that visualizes your own LinkedIN network.  The InMaps pull data from your own LinkedIN profile when you allow access, so you can only see your own network.  

The connections are grouped into clusters based on shared connections and companies.  You can see above that my network has a few clearly defined clusters, but then a large blue area that has no clear cluster information.  You can also learn about you network with some of the visual data built into the map.  People with bigger dots and their names in larger fonts have more connections.

It’s interactive, so you can zoom in to see the individual names, and if you click on a connection, it highlights all of their connections as well.

Check out the quick, descriptive video from LinkedIn’s chief scientist DJ Patil:


For some reason, it doesn’t show every connection between people.  There are a few people in my network that I know are also connected to each other; however, the map didn’t show any connection between them.  Not sure what’s going behind the scenes.

You can publicly share your map on Twitter, Facebook and of course LinkedIN when you click the share buttons.  Here’s mine.  This creates a static image with a legend if you have named your color-coded clusters.  Clicking on the map takes readers to the front page to create their own, but clicking on your name takes them to your LinkedIN profile page.

You can also see some other anonymous maps on the front page by clicking on the “Next Map” button which will change to the background map image.

This one has been popular.  Found on FlowingDataVizWorld, Infosthetics and Mashable.

Thursday
Jan202011

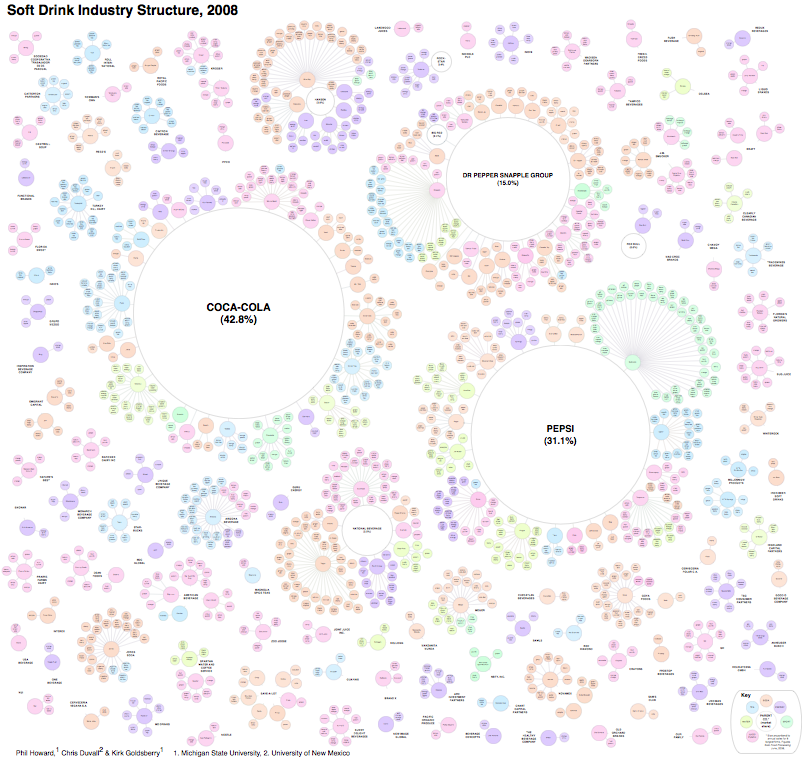
The Illusion of Diversity: Visualizing the Soft Drink Industry


Very cool visualization from Philip H. Howard at Michigan State University called The Illusion of Diversity.  It’s fairly big and hard to read, so I dropped the image link into Zoom.it to create the zoomable image above.  You can see the high-resolution image here, or download the high-resolution PDF here.

Background
Three firms control 89% of US soft drink sales [1]. This dominance is obscured from us by the appearance of numerous choices on retailer shelves. Steve Hannaford refers to this as “pseudovariety,” or the illusion of diversity, concealing a lack of real choice [2]. To visualize the extent of pseudovariety in this industry we developed a cluster diagram to represent the number of soft drink brands and varieties found in the refrigerator cases of 94 Michigan retailers, along with their ownership and/or licensing connections.

Professor Howard’s team did a lot of legwork visiting stores to gather the data, recording 987 different varieties of soft drinks from 94 food retailers in the Lansing, Michigan area.


The statement “Three firms control 89% of US soft drink sales” really means that “89% of the drinks available come from only three firms”.  The distinction is subtle, but there is no sales data included.  This is just an ownership structure.

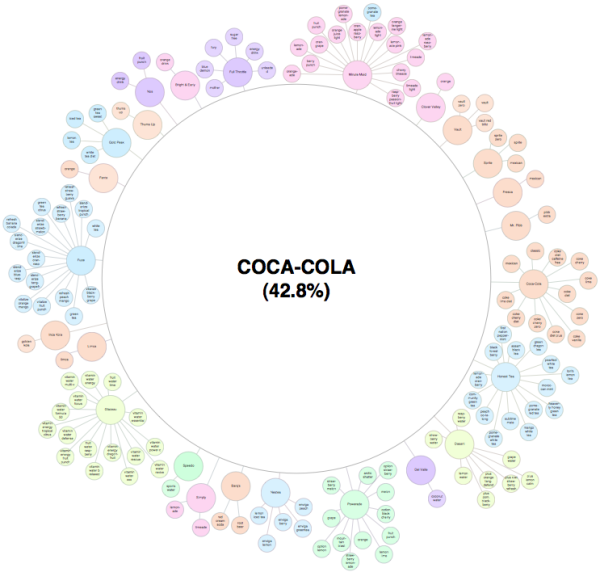
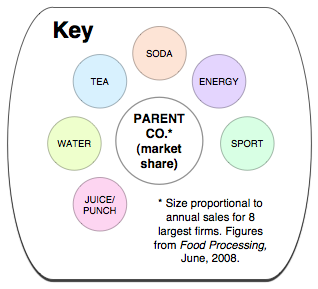
You also have pay attention to what you’re seeing.  The bubble sizes are mixed because the parent company bubbles are sized to the portion of drinks they control, but the size of the individual drink bubbles is consistent and doesn’t convey any meaning.  For the individual drink, the color-coding is what conveys meaning.

Conclusion
The illusion of diversity in the soft drink industry extends beyond obscuring ownership, as its products are primarily water and sweeteners. More research is needed on the links between pseudovariety and the consumption of energy-dense, nutrient-poor substances.

I noticed that this was created using OmniGraffle, which is a vector mapping application that I use a lot.

Found on Infosthetics.com and VizWolrd.com 

Wednesday
Dec292010

The Ride of Your Life


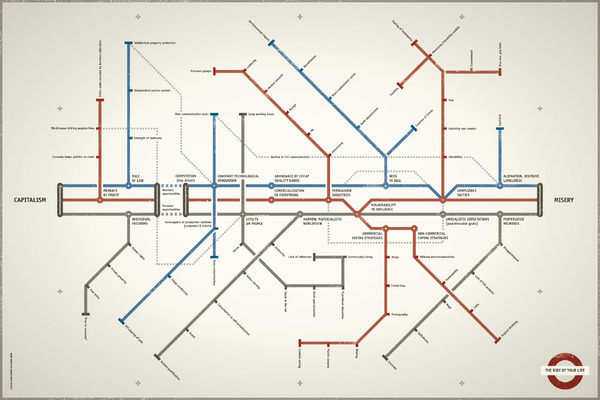
The Ride of Your Life is a very cool, interesting infographic using the subway map design style to show the potential dark side of capitalism.  Created by Lazar Dzamic, Digital Planning Director at Kitcatt Nohr Alexander Shaw in London and designed by Vladan Srdic, Partner and Creative Director at Studio360.

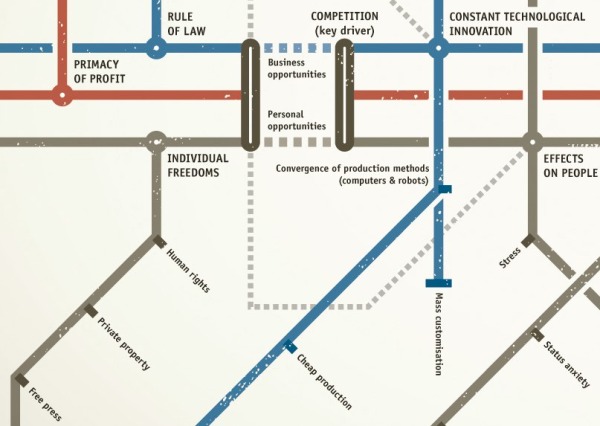
As a reader, you really need to look closely, and appreciate the level of detail and connections included in this design.  The overall message is that the dark side of Capitalism “can” lead to Misery, and the branches explore different aspects of business and personal life influences.


Lazar provided some behind-the-scenes information behind the making of The Ride of Your Life:

“The whole thing was inspired by two books that I would strongly recommend to any communications professional: Robert Cialdini’s ‘Influence: the psychology of persuasion’ and Oliver James’s ‘Afluenza’. Cialdini is a world renowned academic in social psychology applied to persuasion, while James is a psychologist dedicated to investigating the origins of what we also know as the ‘status syndrome’.

I was intrigued by the fact that people in liberal capitalist societies tend to feel less happy than in many others with significantly (sometimes shockingly) less wealth. Which made me think of the role of persuasion industries in that phenomenon.

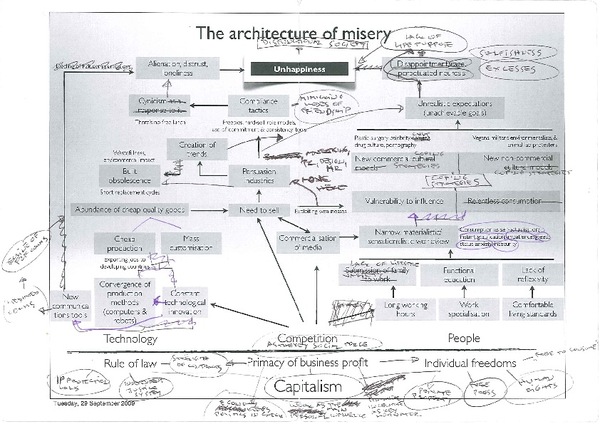
I did the original drawing in one short but frantic session on the inner back cover of Cialdini’s book, but the initial structure has evolved over the last few months, to the one that you see here. The original title was ‘The architecture of misery’ but then I realised that I need a visual partner who will bring it to life. Enter Vladan Srdic, my friend and an incredibly gifted designer from Slovenia, and the ‘spiritus movens’ behind the design Studio 360 in Ljubljana. He not just brought the structure to life by replacing my pitiful clouds with the stylish metro map but also changed its title into ‘Ride of your life’ - which I infinitely preferred.”


Lazar was also gracious enough to share one of his early drafts so Cool infographics readers could see how far the final infographic had evolved from the initial idea.


Fantastic job Lazar for going through the whole process and making your thoughts become a reality.  I want to see the next version exploring the good side of Capitalism!

Wednesday
Nov032010

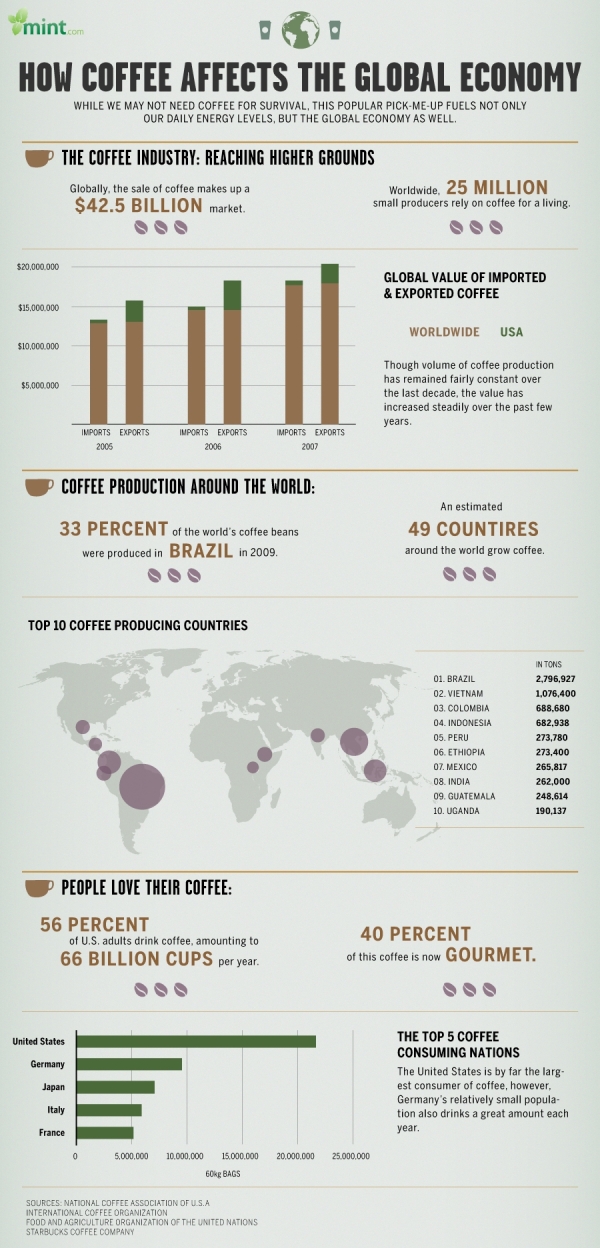
How Coffee Affects the Global Economy


How Coffee Affects the Global Economy is a new infographic on Mint.com and designed by Column Five Media.

We don’t technically need coffee to survive (though many would argue just the opposite), yet this popular pick-me-up fuels not only our daily energy levels, but the global economy as well. The coffee industry thrives in countries like Brazil, Vietnam and Colombia: the world’s leading coffee exporters. Meanwhile, coffee drinkers around the world love their daily morning brew like no other drink. In the United States alone, we consume more than 66 billion cups of coffee per year. Some of us love our java so much, in fact, that we even observe a national coffee holiday, September 29.

There are a handful of statistics included that aren’t visualized, which does seem odd.  For example, “40% of this coffee is now gourmet” could easily have been visualized.

Saturday
Oct302010

America’s Most Haunted Hotels infographic

I really like Snoozing With Ghosts & Ghouls: A guide to America’s most haunted hotels from TravelPost.com.  It’s light on visualizing data, but I like both the content and the easy-to-read graphic.  The locations are the only thing actually visualized, but they could also have done visuals for the Guest Ratings.

Thanks to Ambika for sending in the link!

Page 1 ... 5 6 7 8 9 ... 19 Next 10 Entries »