About
Randy Krum
President of InfoNewt.
Data Visualization and Infographic Design

Infographic Design

Infographics Design | Presentations
Consulting | Data Visualizations

DFW DataViz Meetup

Join the DFW Data Visualization and Infographics Meetup Group if you're in the Dallas/Fort Worth area!

Search the Cool Infographics site

Custom Search

Subscriptions:


Feedburner

The Cool Infographics® Gallery:

How to add the
Cool Infographics button to your:

Cool Infographics iOS icon

- iPhone
- iPad
- iPod Touch


Read on Flipboard for iPad and iPhone

Featured in the Tech & Science category

Flipboard icon

Twitter Feed
From the Bookstore

Caffeine Poster

The Caffeine Poster infographic

Entries in personal (139)

Wednesday
Oct262011

The Anatomy of an Agency

The Anatomy of an Agency from Grip Limited is a tongue-in-cheek cool infographic about the roles within an advertising agency.

Agencies are famously diverse.  We have examined a few of their species and have drawn some arbitrary conclusions.

Designed by Grip’s own Julia Morra and Trevor Gourley.

Friday
Oct142011

Infographics in the Wild - Submit your photos!

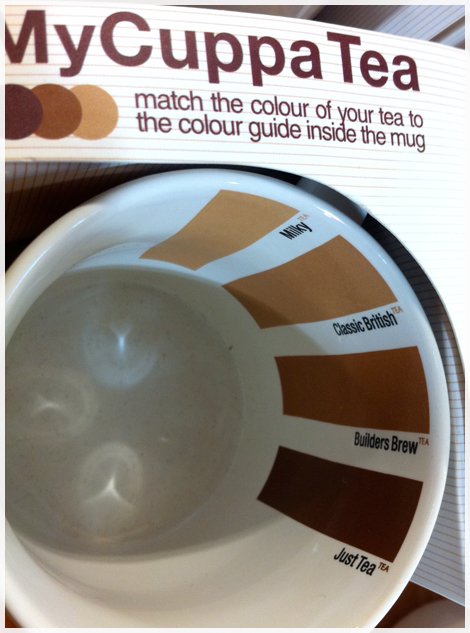
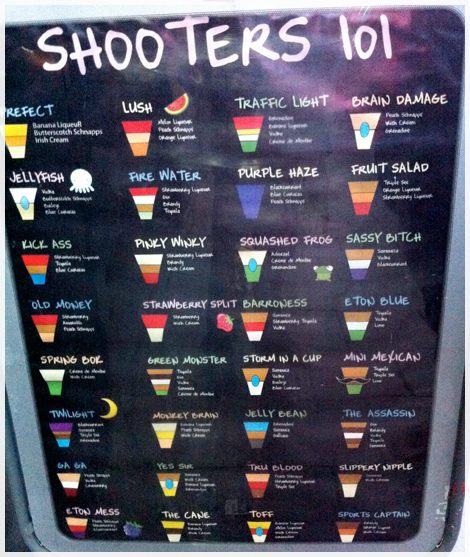
Infographics in the Wild is a new photo group on Flickr started by myself and Robin Richards (ripetungi.com). This photo group is open to everyone.  I post infographics from the Internet here on Cool Infographics almost every day, but there are many, many more examples to be found IRL (in real life) on signs, products, stores, airports, restaurants, etc.  We are asking you to submit any photos of infographics found “in the wild”.

Back in September, Robin posted about Infographics in the wild #1 that he had found around his location in the UK, and we started talking about the idea of starting a photo group where anyone could submit a photo.

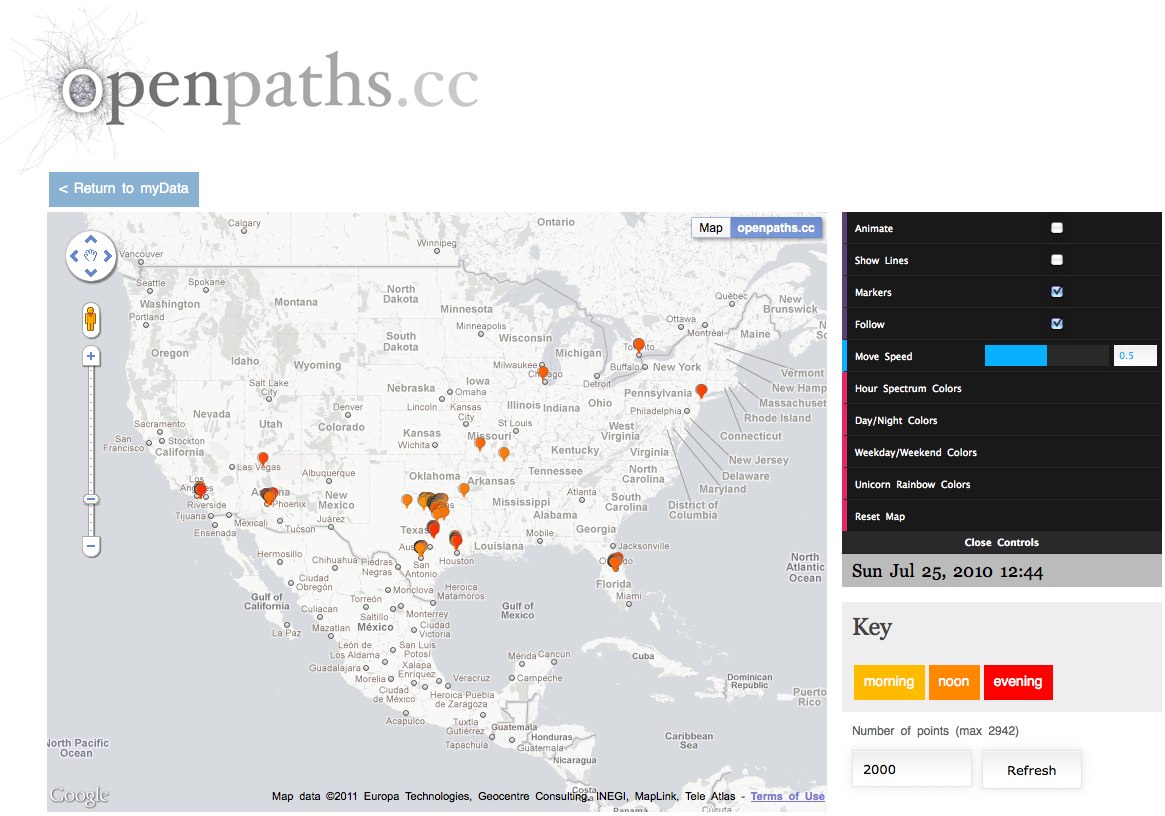
I have set the requirement in Flickr that any submitted photos include a geo-tag location so we can also visualize all of the photo locations on the map - just because we all like seeing stuff like that!

Thursday
Sep082011

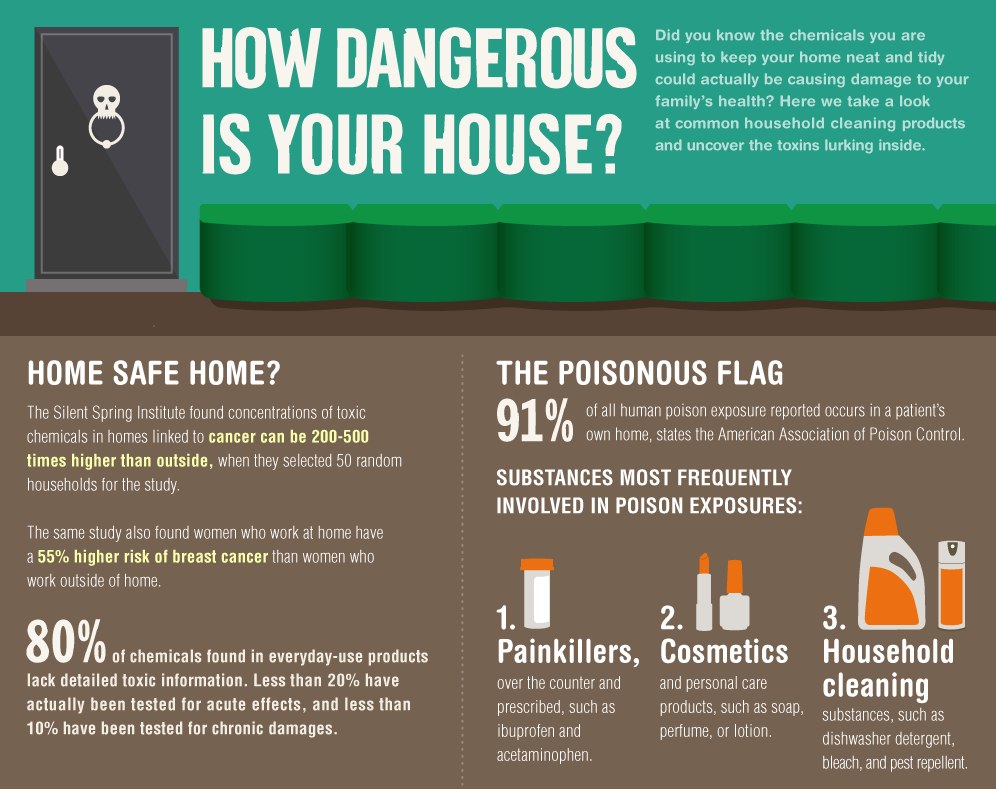
How Dangerous Is Your House?


How Dangerous Is Your House? is a new infographic from Ecomom.com, and designed by Column Five Media.  I love the content in this one!  In fact it reminded me to talk with my son about some of these, however, the overall design has WAY too much text.  Most readers will skim or skip over most of the text explanations.  Why aren’t the statisitics visualized?

Thanks to Jarred for sending in the link!


Friday
Aug262011

Cycling Injuries Revealed Infographic


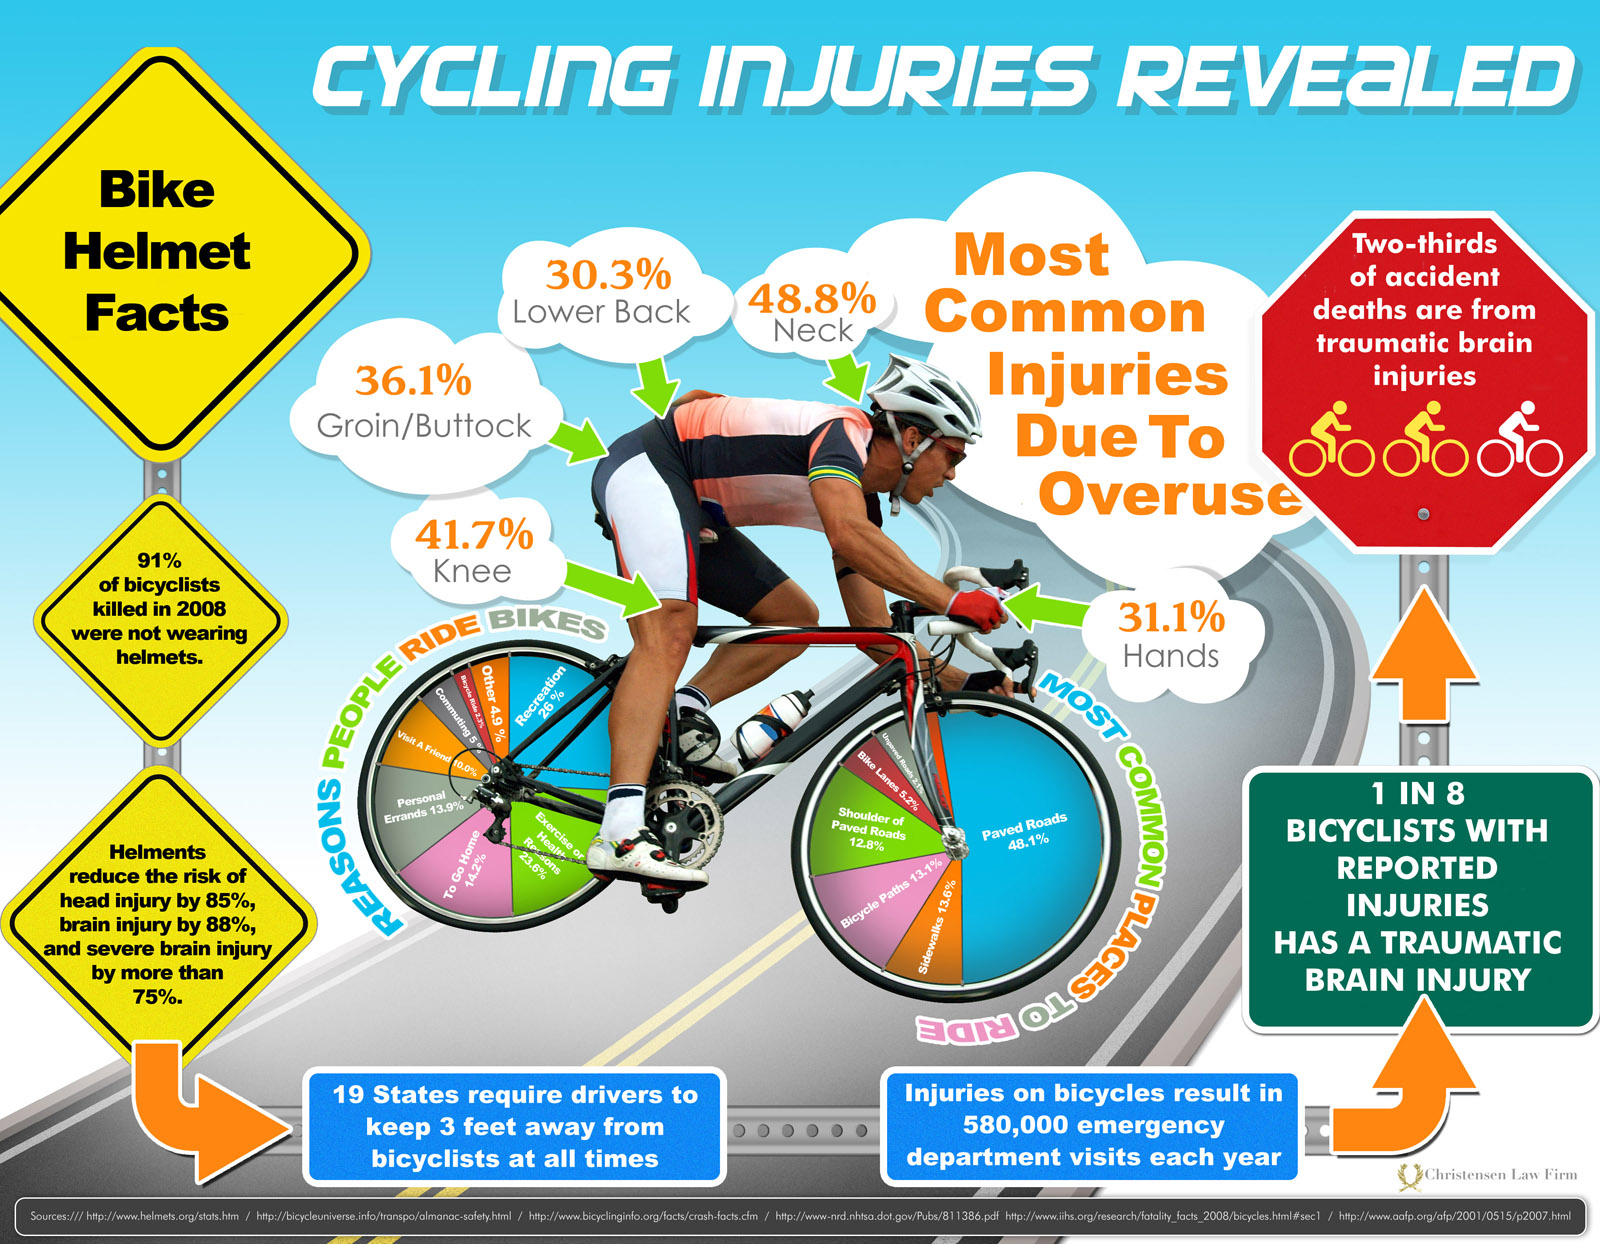
From the Christensen Law Firm comes the Cycling Injuries Revealed infographic.

From an infographic design standpoint, there are both things I really like and don’t like about this one. 

  • I like that the Most Common Injuries statistics are placed around the rider right near the appropriate area of the body, but I don’t like that the clouds are different sizes with no relation to the percentage values.
  • I love the pie charts in the bicycle wheels, but the text is too small to read.
  • I like the use of street signs for the surrounding figures, but they have too much text and those statisitics could have been visualized.  The bicycle rider icons in the Stop Sign are a good example of how the rest of the signs should have been designed.
  • Even the road and sky color in the background helps to make this infographic stand out on a white background nicely.
  • I love that there is a large, center visual that focuses the readers attention on the primary information.

Thanks to Jake for sending me the link!

Thursday
Aug252011

OUTBREAK: Deadliest Pandemics in History


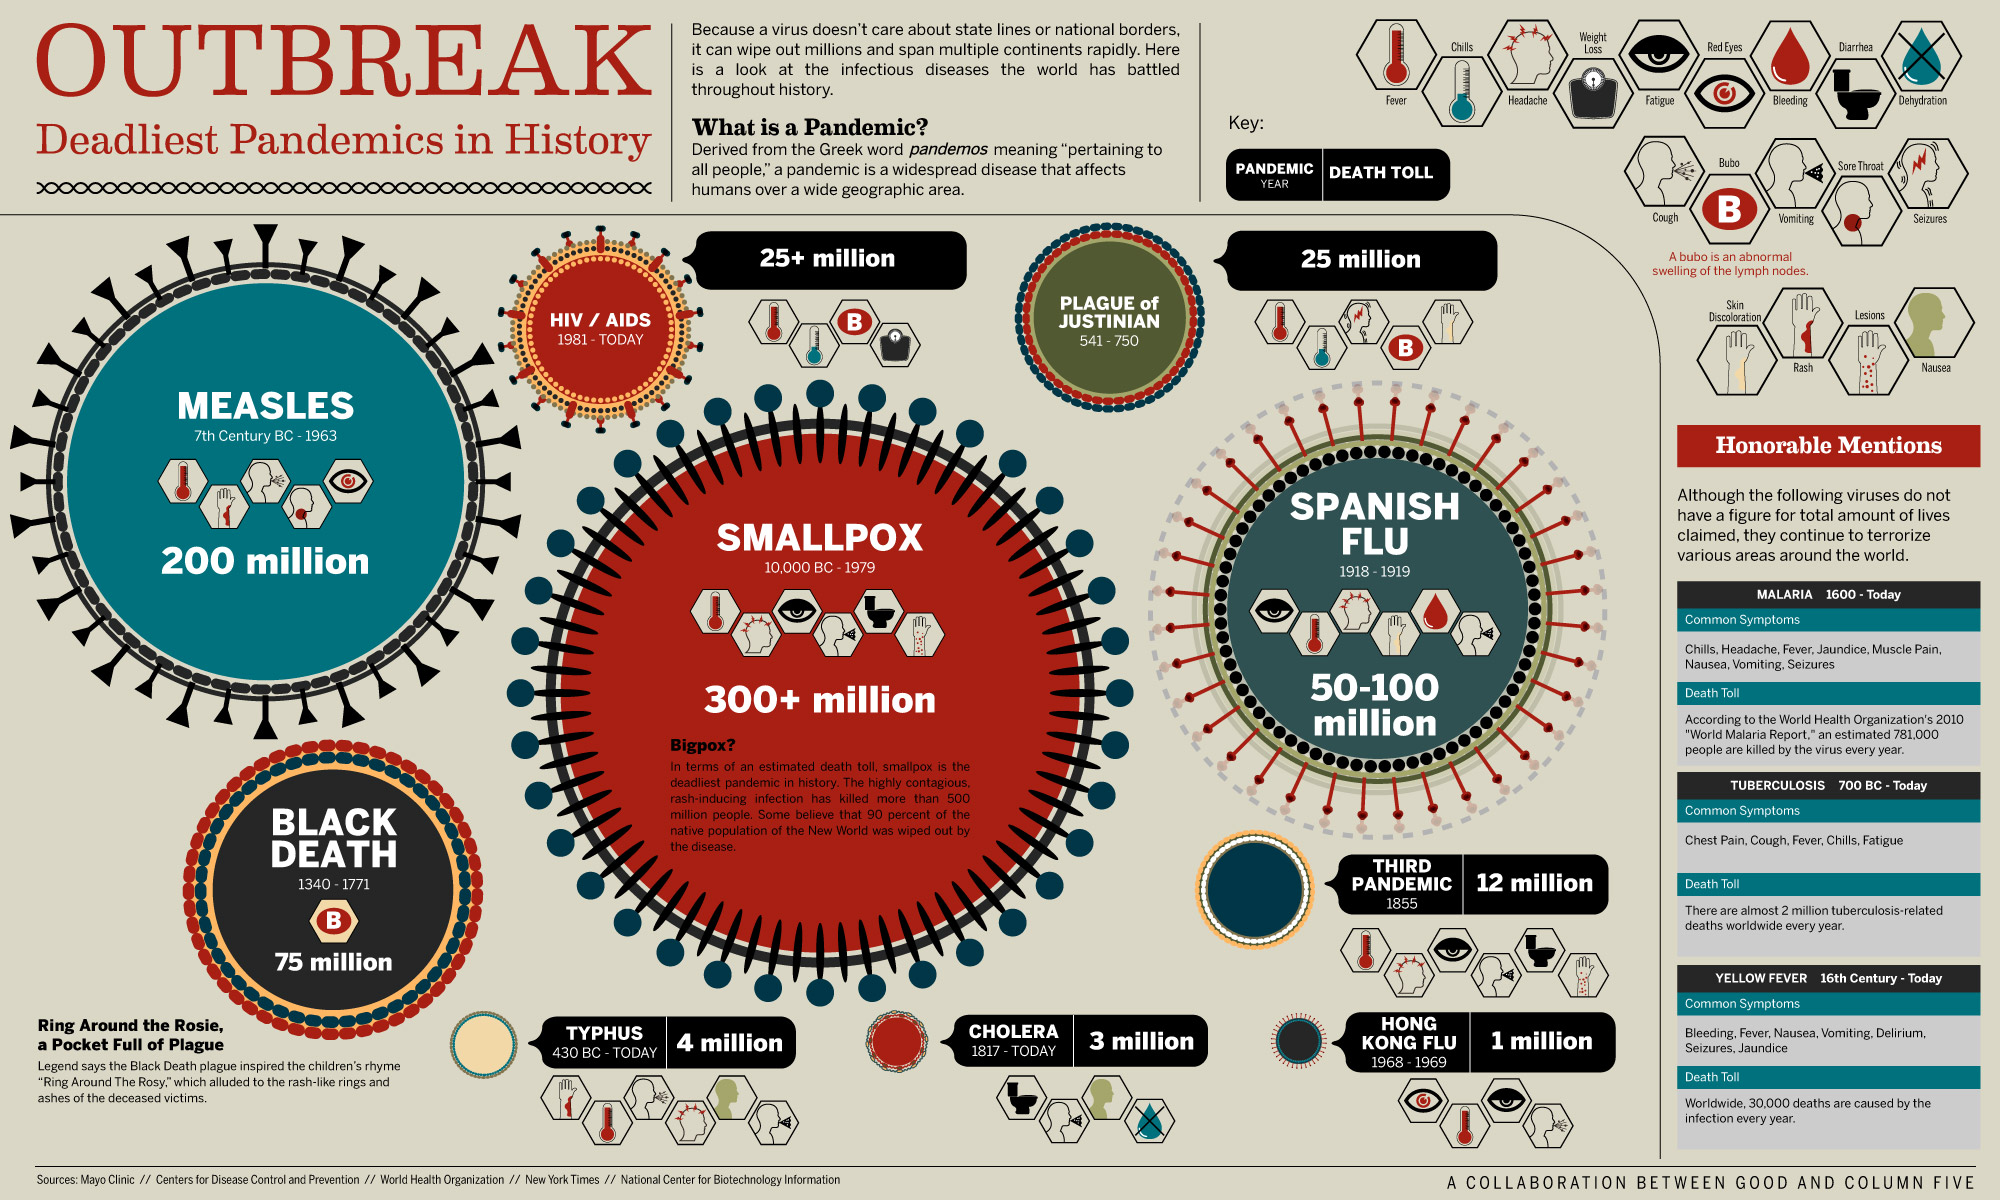
OUTBREAK: Deadliest Pandemics in History is a cool collaboration between GOOD magazine and Column Five Media.

From the Black Death to the measles, rapidly spreading diseases have taken a toll on humanity for centuries. Here’s a look at the biggest and deadliest pandemics ever.

I like the circles for each disease sized to the death toll, and illustrated to look like a virus molecule.  I can’t tell if the extra design elements around the circumference of the circles are part of the circle size or not.  The readers’ eyes see the area of each circle to represent it’s relative death toll compared to the others, but looking at the Measles circle, which radius do you see as the size of the circle?  The solid black line or the outer reaches of the appendages?  I think arguments could be made both ways.

Although I personally don’t like legends, the hexagons to indicate all of the different symptoms of each disease work nicely.  The shape implies scientific information, and the designer spend some time designing icons for each symptom.

This design works very well as an informative piece, and is clear to the reader to understand.  This one will probably have a long online lifespan.

Found on Visual News.

Thursday
Aug182011

The Power of Data Visualization: iPhone Tracking

Inofrmation is power.  Data visualization has the power to change the world!  Change our habits, our laws, our business strategies and what we understand about the world around us.  Our understanding of data forms the foundation of how we make choices, form opinions, and at least one study claims that up to 80% of the human brain is wired just to interpret and remember visual data.

Anyone reading this blog has a basic understanding that data visualization makes things easier to understand.  It puts data into context and allows the viewer to see large data sets summarized in a much smaller space.  I’ve avoided updating to the latest iOS on my iPhone until I could put together this post since it’s such a great example of how visualizing data turns it into information that people can use.

Earlier this year, Alasdair Allan and Pete Warden announced at the Where 2.0 conference that Apple’s iPhones were tracking all of your location data in an open, accessbile file on your computer.  ALL of the location data since the phone was first turned on, which could be years of data.  Heavily covered by the press, you can see their announcement here.  The reason I bring this up on Cool Infographics, is that I believe the visualization itself is what caused this to become a major media event sometimes referred to as “Locationgate.”

Some industry and forensic experts knew about this data already, and many others had tried to to make the public aware of it without any success.  Just telling people that your cell phone is storing location data doesn’t make it real and personal enogh to get the press and the public to care.  In fact, there have been other stories that Google’s Android and Microsoft’s Windows Phone 7 also gather this tracking data, but only Apple’s data was turned into a visualization and captured attention.

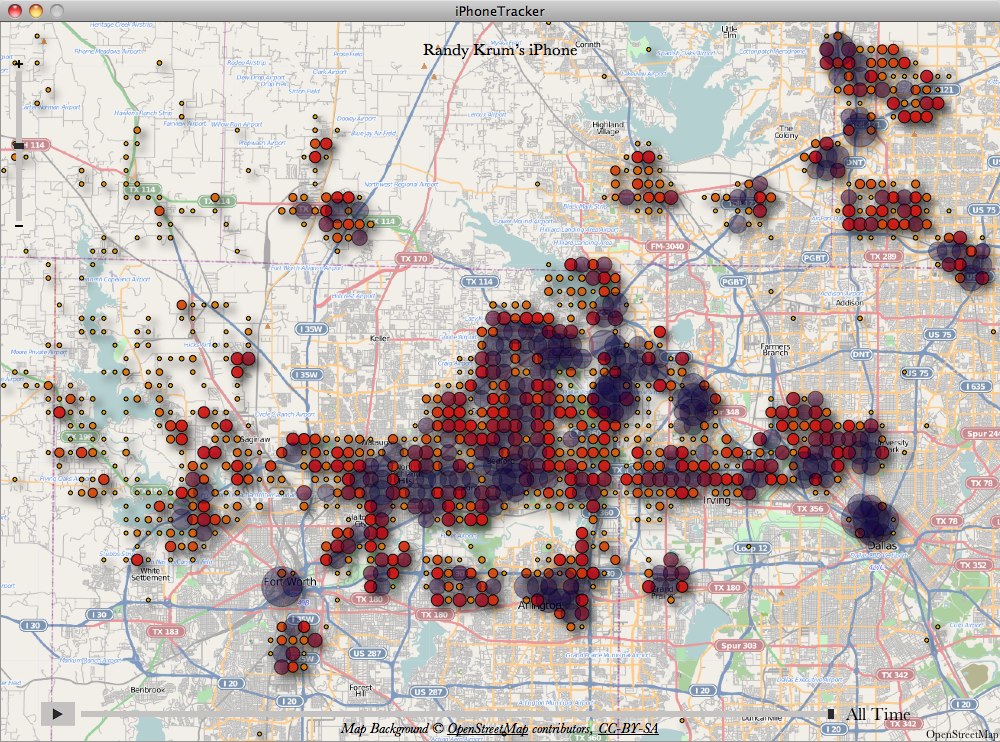
Alasdair and Pete wrote a simple application that anyone could download and use to see their own location data visualized on a map.  This not only made the story more understandable but it made it personal because I could see my own data.

We’d been discussing doing a visualization of mobile data, and while he was researching into what was available, Alasdair discovered this file. At first we weren’t sure how much data was there, but after we dug further and visualized the extracted data, it became clear that there was a scary amount of detail on our movements. It also became obvious that at least some other people knew about it, but it wasn’t being publicized.

iPhoneTracker is an open-source project that visualizes the location data that your iOS device is recording.

Created by Alasdair Allan and Pete Warden using the OpenStreetMap and OpenHeatMap frameworks.
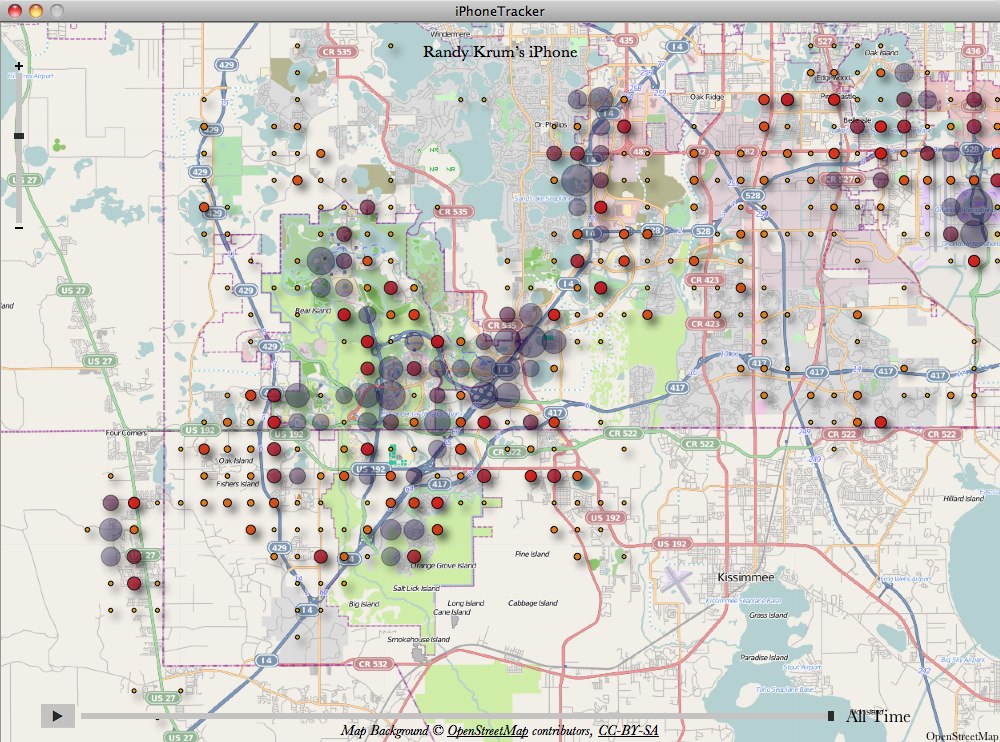
 

As you can see above, they were even nice with data, and aggregated it into a simple grid that isn’t the actual GPS locations or location of the cell towers.  (This shows my trip to DisneyWorld in Florida)  The size of the circles shows the frequency of data points within that specific location.  So the visual shows an approximate location, but the actual data file on the iPhone was much more detailed.  Of course, the application was open source, so others started playing with the code and created much more detailed versions of the software.  Here’s that same data using the Creepy Edition of iPhoneTracker:
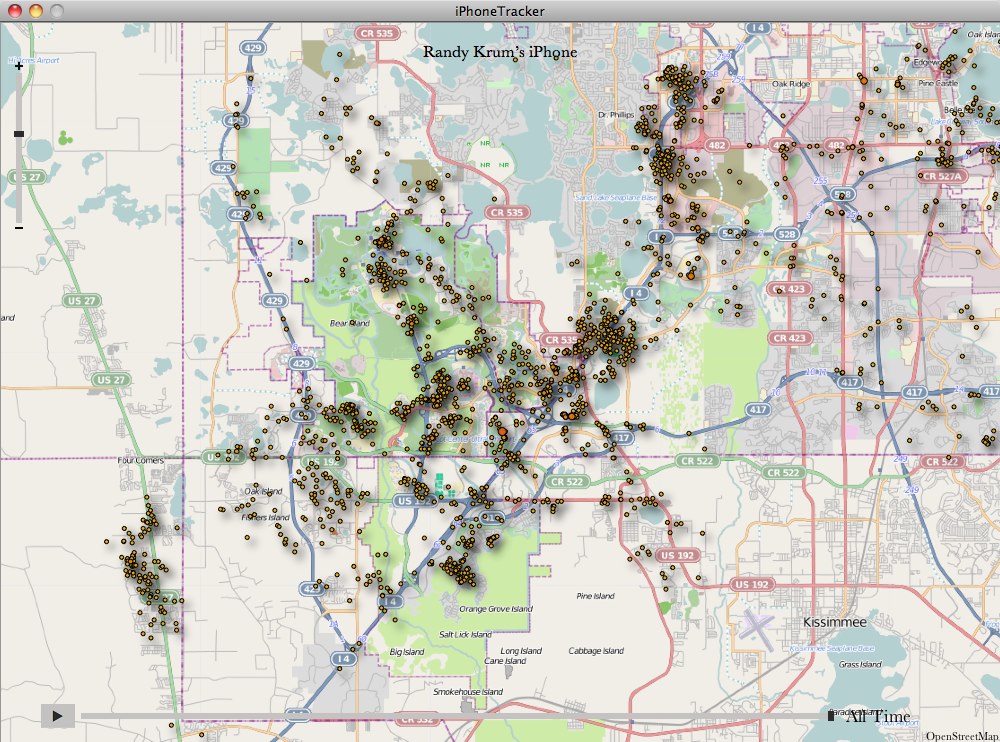


I believe that this use of data visualization to communicate the story was the primary factor that caused a media furor, lawsuits, press releases, interviews, government hearings and proposals to change our laws.

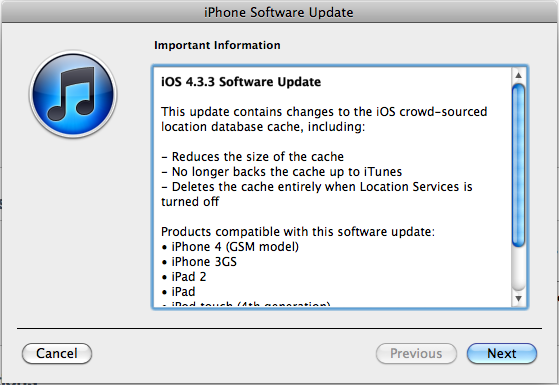
Apple posted an official press release responding to all of the attention and released a software update that deletes most of the historical data.  Sadly, the next time I update my iPhone, the historical data will all be erased.  Personally, I wish I had the option to continue to gather my own data because I’m into this sort of thing.  This file is now also encrypted if you turn on “Encrypt iPhone Backup” so it’s no longer easily accessible.
 

What’s the point?  Data visualization can be used to make your information relevant to your audience and get their attention.  Don’t just tell people your story, show them.


Monday
Jul112011

Client Infographic: Facebook, Privacy and Health

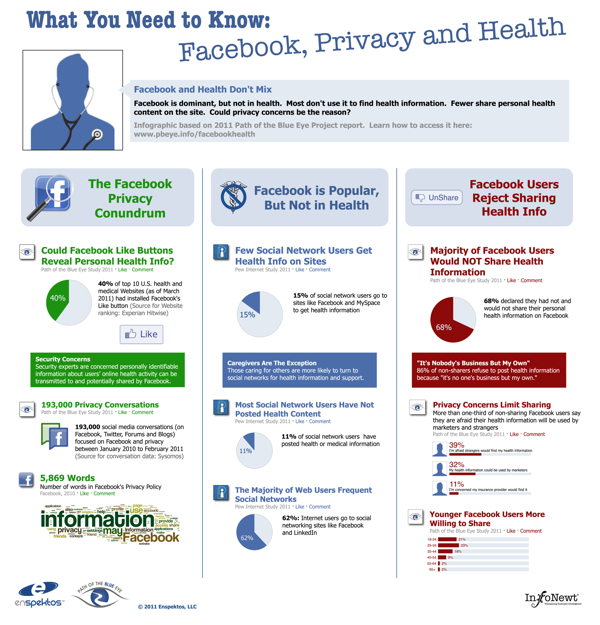
For the Path of the Blue Eye Project, InfoNewt (my company) recently designed the infographic: What You Need To Know: Facebook, Privacy and Health.  The group at the Path of the Blue Eye Project has done some fantastic, primary research about online users’ willingness and attitudes about sharing health information online, and specifically Facebook.

The answer is overwhelmingly “NO”.

If Facebook is so popular (Pew reports that 62% of Web users frequent sites like Facebook and MySpace), why are people shying away from sharing health content with others on the site?  To answer this question, the Path of the Blue Eye Project commissioned a national survey designed to tease out some of the reasons why Americans are reluctant to exchange health information on Facebook.  We found:

  • 68% of Facebook users have not and would not share their personal health information on the site. The most commonly cited reason for refusing to share: “it’s no one’s business but my own (86%).”
  • Privacy concerns may be one reason many refuse to share.  39% of non-sharers were afraid strangers would find their health information and 32% worried marketers might use it to sell products and services.

Online users do a lot of searching for health information, but very few are willing to share any of their own information on social sites like Facebook.

The Facebook Privacy Policy is huge, and most of the concerns why oline users are unwilling to share online information have to do with unintended people finding their information.  Insurance companies, marketers and strangers top the list of concerns.

Thanks again to Fard and the team at Enspektos.com.  There’s much more information available at the Path of the Blue Eye Project.

Friday
May272011

The Information Blanket

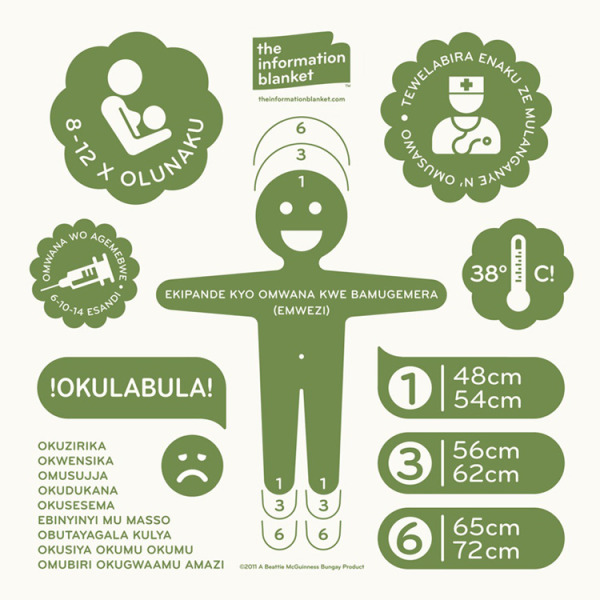
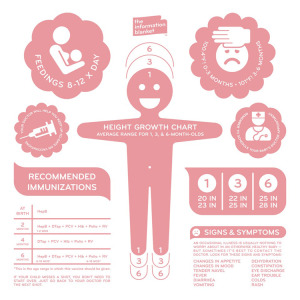
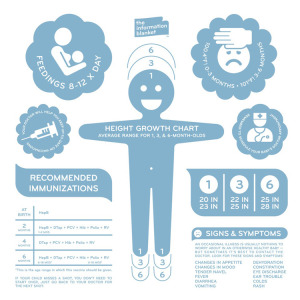
The Information Blanket is a very cool project conceived and produced by Beattie McGuinness Bungay New York.  Intended as a charity blanket to be donated to kids in under-developed countries, the blanket is printed with information to help the mothers learn about their baby’s health.  The blankets include information about breastfeeding, immunization vaccinations, body temperature and warning signs of illness, all printed in the local language.

There are two ways to participate.  You can buy one for yourself, and one will be donated automatically ($60) or you can just donate one to a child Uganda ($25).  The ones you buy for your self are in English (pink or blue), and the ones that will be distributed in Uganda are in Lugandan (green).


the story of our blanket is one of care and responsible craftsmanship. it begins with green-sensitive 100% double knit north carolina cotton. soft and durable, it meets the strictest u.s. environmental standards on dyes and finishing. when it’s ready, the fabric is pre-shrunk and shipped to new york city where local craftsmen cut it to swaddling size and double lock stitch the edges. the informational graphics are then screen-printed using non-toxic water based inks. the result is a blanket of the highest individual quality.

Our design includes a growth chart with average ranges for one, three and six months, breastfeeding and vaccination frequency, high temperature alert, doctors appointment reminder and a list of illness warning signs.


Found on Twitter via @katerryna and Creativity-Online.com

Friday
May202011

Expert Driving Techniques #infographic

Here’s a good one to start the weekend.  From imingle.com comes Expert Driving Techniques That Could Save Your Life.

This has got to be one of the longest infographics I’ve seen, so I shrunk it down a little bit to post here.  I know my readers like to see the whole infographics when I post them, but you can see the full-size version here.

Not many statistics or data visualizations, but really good driving advice and some good illustrations to make them easier to understand.  Some of the illustrations (like braking methods) look like data visualizations, but there’s no data behind them

Thanks to Brittany for sending in the link!

Wednesday
May112011

Student Bullying infographic

Student Bullying
[Source: Buckfire and Buckfire.com]

From Buckfire & Buckfire in Michigan, comes an infographic about Student Bullying in the U.S.

Student bullying in schools in the United States is a serious issue and very prevalent in our school systems today. The statistics show that a student is bullied every seven minutes in our country and that most bullying occurs on playgrounds. The effects of bullying are profound and have a major psychological impact on the bullied student and often causes learning problems in the classroom.

The majority of states have bullying laws on the books, but most are not significant enough to impact this problem or reduce the amount of bullying that occurs nationwide. Without more stringent laws and the actual enforcement of those laws, school systems will not feel the pressure to take the affirmative measures necessary to eliminate the bullying problem that terrorizes so many innocent and vulnerable children everyday.

The lawyers at our law firm receive calls from concerned parents every week about their children who are being bullied in Michigan schools. We are actively pursuing lawsuits in several cases. We created the infographic below to display the facts and statistics about student bullying.

I really like the statistics shared in this one, although they should have visualized more of the numbers.  A value like 160,000 students miss school every day out of fear could be put into context if they had visualized it in comparison to total students or something like that.  

I really like the fact that since they get so many calls from parents, that they chose an infographic to reach out to their customers to share some of the facts.  This is a great example of using an infographic to provide valuable information to parents and teachers everywhere.  People will share it because it’s good content, and some may eventually become new customers.

Thanks to Kathryn for the link!