About
Randy Krum
President of InfoNewt.
Data Visualization and Infographic Design

Infographic Design

Infographics Design | Presentations
Consulting | Data Visualizations

DFW DataViz Meetup

Join the DFW Data Visualization and Infographics Meetup Group if you're in the Dallas/Fort Worth area!

Search the Cool Infographics site

Custom Search

Subscriptions:


Feedburner

The Cool Infographics® Gallery:

How to add the
Cool Infographics button to your:

Cool Infographics iOS icon

- iPhone
- iPad
- iPod Touch


Read on Flipboard for iPad and iPhone

Featured in the Tech & Science category

Flipboard icon

Twitter Feed
From the Bookstore

Caffeine Poster

The Caffeine Poster infographic

Entries in visual (320)

Monday
Aug202012

ROI = Return On Infographics

ROI Return On Infographics


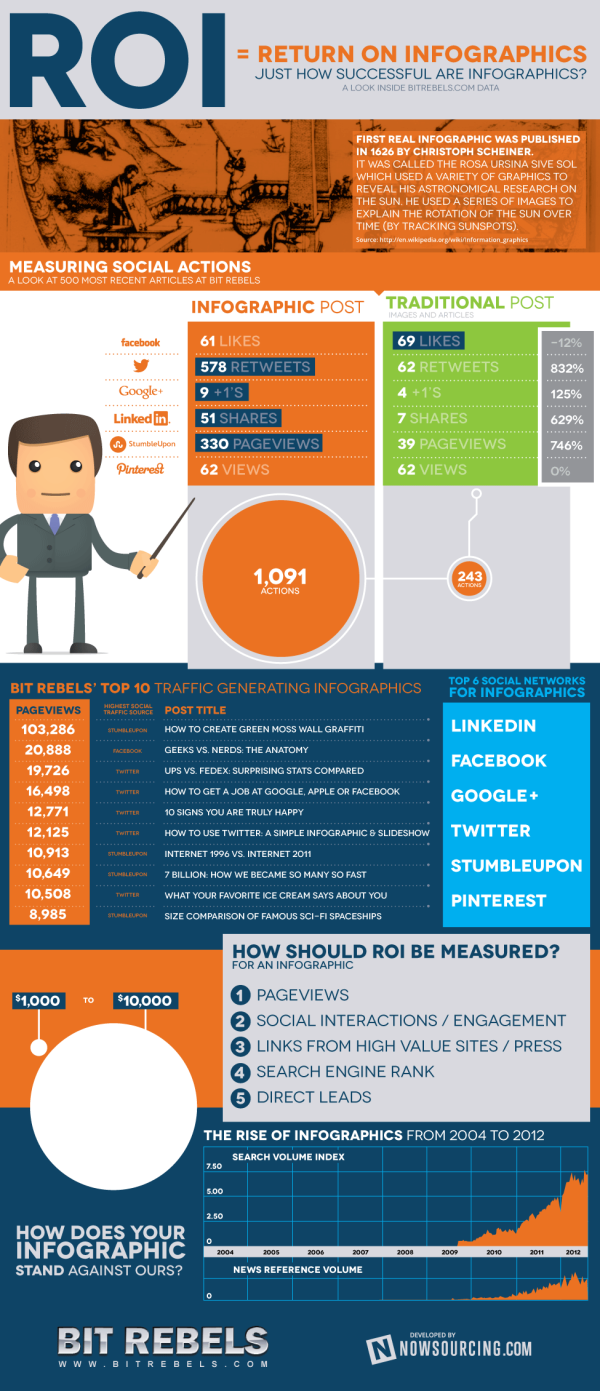
Infographics about infographics are always fun.  Return on Infographics by Bit Rebels and NowSourcing takes a look at some of Bit Rebels’ own data from releasing infographics as part of their marketing.

The impact of an infographic can be measured on many levels, which makes it all just a little bit more complex and complicated to present. With the help of NowSourcing, we have been able to produce an infographic that will compare the traffic and social action impact of an infographic post with a traditional post that does not involve an infographic. It’s through social media analytics that a clear image slowly emerges to tell a story that for some has just been a question without an answer.

They’re pretty clear about this, but remember that this design is completely based on internal data from Bit Rebels.  It may be a good indicator of infographics in general, but we don’t know for sure.

Bit Rebels has shared some fantastic data from their internal tracking, which will be of interest to the you, the readers of Cool Infographics.  However, the design makes a few mistakes, and we’re all here to learn how to make infographics designs better.

  • One of my pet peeves, the design messed up the size of the circles in the comparison table.  Based on the full-size infographic they released at 975 pixels wide, the smaller circle for 243 Actions is about 55 pixels in diameter.  Doing the match for the area of a circle, the diameter of the larger circle for 1,091 Actions should be about 117 pixels wide.  In the design, it’s actually about 256 pixels wide!  So instead of visually showing a shape roughly 4x larger, it’s actually showing a circle about 22x larger!  This is a “false visualization” and mis-represents the data.
  • Are these comparison data points an average or a total of the 500 posts?
  • How many infographic posts are compared to how many traditional posts?
  • Love the use of the actual logos from the social networks in the comparison table, and they should have continued that with the rest of the design instead of just text later in the design.
  • The blue bars behind the higher comparison value look like bar charts, but obviously don’t match the data.  They just fit the text, and have no visual relevance to the data.  An indicator icon or highlighting the entire column width would have been better than the bars.
  • Are the Top 6 Social Networks in rank order?  LinkedIN is the top social network for infographics???
  • The circles near the end of the design are also incorrect.  Instead of showing a 10x comparison to match the dollar values, the circles show an over 100x comparison!

Found on WebProNews, MediaBitro’s AllTwitter, and Visual.ly.  Thanks to everyone that also submitted it and tweeted links to it!

Friday
Jun152012

200+ Infographic Resumes, an escalating trend

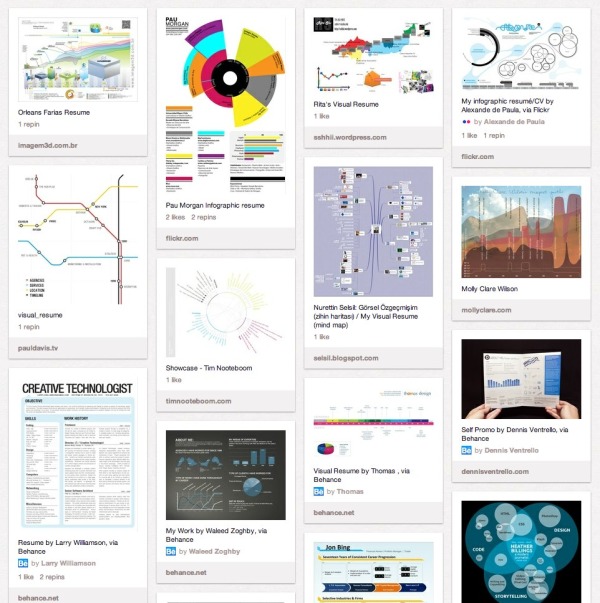
Pinterest Board of Infographic Visual ResumesPinterest Board of Infographic Resumes

Back in January of 2010, I posted 16 Infographic Resumes, A Visual Trend that highlighted the start of the trend of infographics and data visualization moving into resumes.  Why 16?  Because that’s how many good examples I could find at the time on the Internet to showcase the concept.  Two and a half years later, that post continues to be one of the most viewed blog posts on Cool Infographics with an average of 3,500 views every month.  A 2.5 year-old blog post!

Since then, the idea of infographic visual resumes has exploded.  I have continued to gather links to infographic resumes, and my collection is now over 200 examples of infographic resumes that have been published online.  Instead of trying to post them here on the blog like I did in 2010, I’m experimenting by creating a Pinterest Board dedicated to sharing Infographic Visual Resumes.  I will continue to add resumes and grow the board, so follow the board if you want to see new ones as they are addded.  If you know of any that I should include, add the link in the comments or send a link through the Contact form with “Infographic Resume” in the Subject line. 

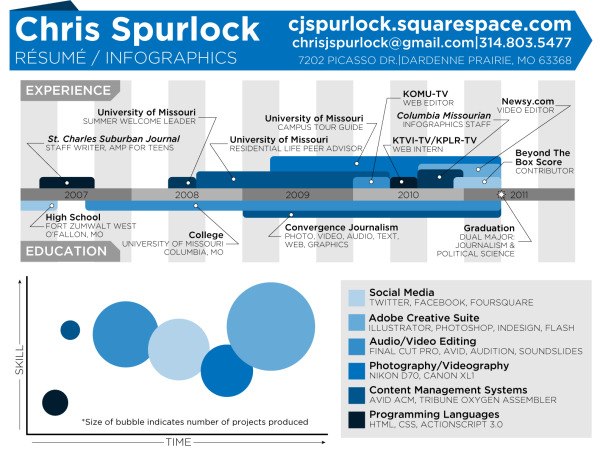
The Cinderella Story example is the Chris Spurlock resume shown below.  The story is that Chris was a graduating Journalism major at Missouri School of Journalism in early 2011, and created his infographic resume because he wanted to pursue data journalism as a career.  It was posted on the J-School blog, but quickly went viral on the Internet.  As a result, he was hired as an Infographic Design Editor for the Huffington Post!

Chris Spurlock infographic resume

I haven’t made any distintion between good and bad designs on the Pinterest board, because all of the designs can give you good ideas about types of data visualizations you can include in your own design.  The only distinction I have made is that they have to include some type of data visualization to be considered infographic.  There are many, many great graphic designer visual resumes that aren’t “infographic” so they aren’t included on the board.

Also, I have attempted to link each design back to the original owner’s site (like Chris’ resume above), but for many the public posting is on a portfolio site like Behance or Visual.ly.  If any of these should be linking to a different location, please send me a note through the Contact page, and I’ll get them linking to the correct places.

It’s definitely worth mentioning that there are a whole bunch of new online sites launching to capitalize on this growing trend.  The service they offer is to create an automatic infographic resume for you, usually based on your LinkedIN profile.  Vizualize.me, re.vu, Kinzaa, ResumUP and cvgram.me all create an infographic resume for you using their pre-designed templates.  I’ve tried to only include a couple examples from each service because 50 resumes based on the same template won’t provide you more inspiration to design your own.  My opinion is that these sites and templates are currently new enough to help your resume stand out, but very quickly the risk is that the templates will become recognized (like PowerPoint templates).

I’m planning a separate, future post about the best practices when designing your own infographic resume, but I wanted to shared the Pinterest Board with you as a resource for inspiration.

Please add a comment with your thoughts about the future of infographic resumes!

Wednesday
May092012

TEDTalk Video: Information is Food

In March 2012, JP Rangaswami gave a short TEDTalk in Austin, TX, Information Is Food, about treating information similar to how we treat food.

How do we consume data? At TED@SXSWi, technologist JP Rangaswami muses on our relationship to information, and offers a surprising and sharp insight: we treat it like food.

With a background in economics and journalism, JP Rangaswami has been a technology innovator and chief information officer for many leading financial firms. As an advocate for open source and disruptive technologies, Rangaswami has been a leading force in the success of multiple startups, including School of Everything, Salesforce.com and Ribbit. He blogs (unmissably) at Confused of Calcutta.

This is an interesting concept, and was appealing to me because I talk about humans evolving into Informavores in my presentations about infographics and data visualization.

The analogy is that we have food consumption issues that cause health problems, and we can have information overload issues that can cause issues with understanding and our belief systems.  I loved the quote from the presentation posing the question: “Are we going to reach the stage where information has a percentage of fact associated with it?”

The video is also available on YouTube:


Thursday
Apr262012

The Eagle Scout Infographic

The Eagle Scout infographic is a new design from the Boy Scouts of America, and shows them experimenting with using infographics to share their message.  It’s odd that I can’t find any mention of it on Scouting.org, but found it posted on the Bryan On Scouting blog, which is the official blog from Scouting Magazine, and posted in the official BSA Twitter stream (@boyscouts).  There’s also a high-resolution PDF file available for download if anyone wants to print it out.

My son just bridged over to Boy Scouts from Cub Scouts, and their national office is here in the DFW area, so I was naturally interested.  This is a really good first attempt at an infographic design from their design team, but makes a few mistakes visualizing the data.

  • Good use of the red, white and blue color scheme.  It’s clearly scouting, and specifically related to Eagle Scouts
  • The data being presented is fantastic since only the BSA would have access to many of these statistics.
  • I love the choices of imagery used.  The embroidered patches and icons used for the scouts keeps the design clean and easy to read.  Many BSA publications use a lot of full-color photos of the scouts, and that would have added too much visual noise to an infographic design.
  • The BSA logo at the top clearly identifies this as an official publication, but it’s missing a title.  What should we call this infographic?  Why should I read this infographic?  Something like “100 Years of Eagle Scouts: By The Numbers” would have worked nicely.
  • The information included will change over time since the data is a current snapshot of the state of Eagle Scouts.  2,151,024 Eagle Scouts as of what date?  The infographic should more clearly identify the date that the data is gathered from, because people will be looking at this for years on the Internet.
  • Filling unusual shapes to show percentages is always a challenge.  With images like the hand icon and the globe you can’t just calculate the height of the colored area like a bar chart.  You have to calculate the AREA of the space to be colored, or you end up with false visualizations like these.
  • The same is true for sizing shapes, like the people icons for the Average Age of Eagle Scouts visualization.  You have to size the overall AREA of the shapes to match the data being presented, which is hard with complex shapes.  You can’t just change the height.
  • The space shuttle avoids this issue by only coloring a rectangular shape in the middle, turning it into a stacked bar chart, but the visualization doesn’t match the data.  The red colored section is visualizing more than 60 astronauts as Eagle Scouts, when the number shown is only 40.
  • I love the Eagles by Decade data, but avoid 3D charts.  The 3D effect doesn’t add anything to the data being presented and it’s incosistent with the rest of the design.  The data tells a great story, and clearly shows that Boy Scouts continues to grow strongly and is a viable organization in the 21st century.
  • I like this use of the word cloud for Notable Eagles, but don’t change the font sizes because in infographic design this is assumed to convey data.  With Brave and Loyal in larger fonts, it implies that these are more important than all of the other virtues.  The virtues should all be one, consistent font size, and the names should all be a second font size.
  • At the bottom, there should be a copyright (or Creative Commons) statement, and a URL for readers to be able to find the original high-resolution version. 

Thanks to Dean for sending in the link!

Tuesday
Apr102012

How Animals See The World

Ever wonder how you look to your dog or cat? Or how about the shark as he swims towards you? (Lets hope  you haven’t thought of the second one…) Well have no fear, all your answers lie within the How Animals See The World infographic from Mezzmer

Have you ever stopped and wondered what version of the world your beloved dog or cat sees the world in?  How is their perception colored and how do they perceive you?  Most of us take for granted the gift we are granted with sight, but it may surprise some of you to find out that many animals actually have much better vision than we do.  In fact, some see the world with some precision and accuracy, they put our eyesight abilities to complete shame.  Read on to learn more about the unique ways our animal friends see the world…

The design is longer than I like for infographic, but the content is fascinating.  Not many data visualizations, but I really appreciate the designer showing comparisons between what a human sees, and the equivalent view from the animals. 

Mezzmer is an eyeglass online retailer, so this infographic topic is information relevant to their business without feeling like an ad.  A great topic selection for a Marketing infographic.

Thanks to Christina for sending in the link!

Friday
Apr062012

Augusta National Golf Club - Then and Now

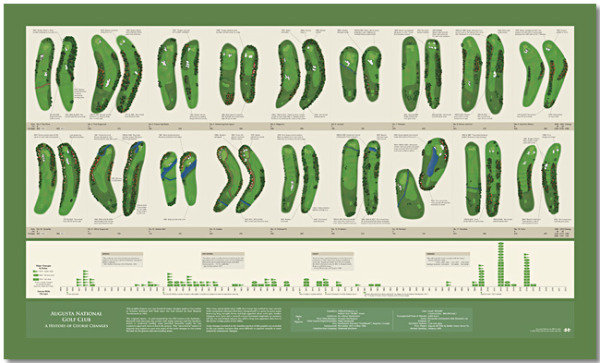
Bill Younker from Historyshots.com has designed a new infographic poster!  Augusta National Golf Club- Then and Now, shows how the famous golf course has changed since its first Masters Tournament 79 years ago!

Augusta National Golf Club has undergone continuous modification since hosting its first Masters Tournament in 1934. This graphic depicts the more than 100 major changes made to the course over the past 79 years. At the top is a visual side-by-side comparison of each hole for 1934 and 2012. Below the hole comparisons is a timeline that maps tee, fairway and green area changes year-by-year. The combination of visual comparison and detailed timeline provides a sweeping overview of all the major changes made since 1934.

This is a great design that demonstrates how simple visuals can be used to show the viewer differences between the hole designs.  By showing a terrain map of each hole then and now, side-by-side, the poster is easy for viewers to compare the changes and enjoy.

You can buy the 40” x 24” inch poster for $34.95 and definitely check out the zooming viewer to see the poster up close at Historyshots.com.

Great job Bill!

Monday
Apr022012

Jer Thorp: Make data more human

Jer Thorp works in the New York Times labs to design big data visualizations, and his great presentation from TEDxVancouver was just posted.

Jer Thorp creates beautiful data visualizations to put abstract data into a human context. At TEDxVancouver, he shares his moving projects, from graphing an entire year’s news cycle, to mapping the way people share articles across the internet.

Jer Thorp’s work focuses on adding meaning and narrative to huge amounts of data as a way to help people take control of the information that surrounds them.

He’s been involved in some great big data projects that I have posted about here on the blog previously, like OpenPaths.

Friday
Feb242012

See Mix Drink: Infographic Cocktails

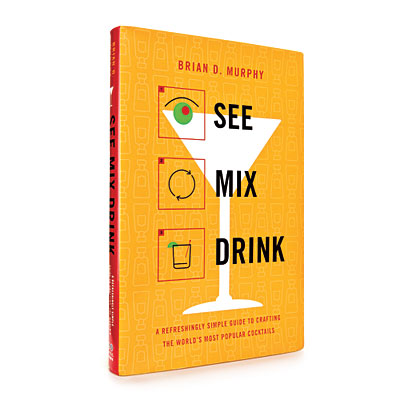
The See Mix Drink Cocktail Guide is a fabulous infographic drink recipe book from Brian D. Murphy (@murph_e).  Currently available for about $10 on Amazon.com, it’s on my wish list.  Featured on GQ.com back in October when it was released, I have been totally remiss by not posting about it until now.  (My apologies Brian!)

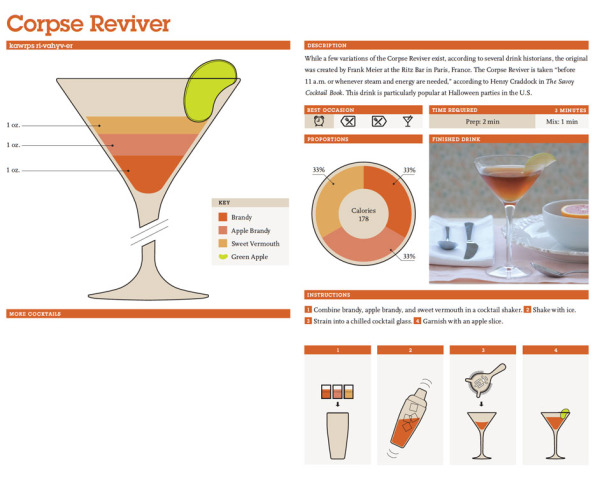
Have you tried mixing a Mojito? What about a Rusty Nail? Or a Cosmopolitan? With See Mix Drink, the first-ever cocktail book to offer instruction through info-graphics, making the drinks you love at home is as easy as, well, See, Mix, Drink.

This unique, illustrated guide graphically demonstrates how to make 100 of today’s most popular cocktails. For each drink, color-coded ingredients are displayed in a line drawing of the appropriate glassware, alongside a pie chart that spells out the drink’s composition by volume for intuitive mixing. No other cocktail book is this easy or fun. Instantly understandable 1-2-3 steps show exactly how each drink is prepared, and anecdotes, pronunciation guides, and photographs of the finished drinks will turn newbie bartenders into instant mixologists. 

The GQ.com feature has the designs for ten of the recipes from the book.  They are all simple to understand, and easy to follow.

One thing I would suggest to improve the visualization design style is to combine the key and the ingredient portions.  No need to make the reader look to both sides of the glass illustration to figure out how much of each ingredient.  Just putting the name with the amount on the left side and getting rid of the color key would eliminate an eye motion for the readers.

Thanks to Brian for sending in the link (back in October!) and congratulations on the publication!

Monday
Feb062012

Infographic Events Calendar 2011-2012

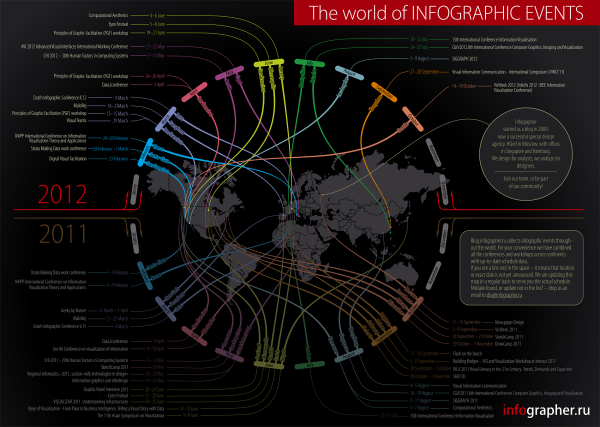
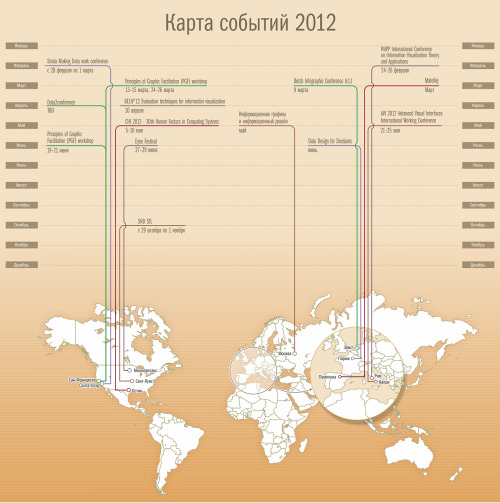
Outstanding calendar-map infographic from Infographer.ru, a Russian infographics site and design agency in Moscow (view in English).  The Infographic Events Calendar 2011-2012 shows many (but not all) visualization, data and infographic conferences and events around the globe.

For everyone who is interested in information design we prepared the events calendar. We found over 44 conferences and workshops, dedicated to infographics and visualization topic all over the world.

The idea to make this kind of ‘map-calendar’ of events appeared in our mind a long time ago, we started to collect data in 2011 and suddenly 2012 started. So we decided to combine both years and show the history for 2011 and actual events for 2012, which you can use for your personal planning.

They collected over 40 conferences and workshops dedicated to information visualization for last year and the upcoming schedule for 2012.  The calendar-map color codes the events by month and obviously connects them to the correct location on the world map.

If you know any corrections or additions to the event included, please post them in the comments!  I know they will be reading them, and would welcome all feedback.  Here are a few events I think they should add to their list:

  • South by Southwest Interactive, Austin, TX, March 9-13, 2012
  • TDWI World Conference (Tableau), Las Vegas, NV, February 13-15, 2012
  • Big Data 2012, Paris, France,  March 20-21, 2012

I like the text of the city name included in the connecting lines, and the months with no events are gray so they don’t add to the visual noise of the bright colors.  Somewhere on the design they should have included the URL for people to find their original posting.  When this get shared online, readers will have a hard time finding the original site.

Infographer also posted some behind-the-scenes information about the development of the design.  Check out their early drafts in the complete blog post.

Thanks to Irina for sending in the link and posting the English translation of the development process!

Tuesday
Jan242012

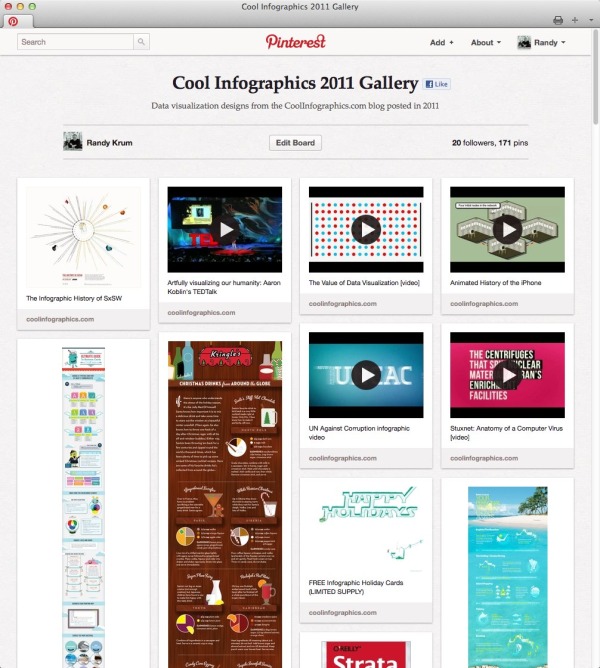
The Cool Infographics 2011 Gallery...A Pinterest Experiment


Check out the Cool Infographics 2011 Gallery!  I’m trying an experiment using Pinterest to create a one-page, visual gallery of the infographics I post.  On this board I have pinned every post from the Cool Infographics blog from last year, and it makes a really nice, visual way to browse through the infographics I have shared.  One of the reasons I wanted to play around with Pinterest is that it displays the entire (sometimes very long) infographic, not just a square thumbnail like many galleries.

In general, I keep the 10 most current posts on the front page of the blog.  Once they scroll off the front page, of course their traffic and visibility drops off dramatically.  I’m looking for a way to create a live, growing gallery of the infographic images so these great examples of design can continue to be easily discovered.

Because infographics is, by definition, a visual media, I think people would be more likely to find examples they like and inspiration for their own type of design if there was a better way to browse.  I’m not sure that Pinterest is the answer yet, but it’s certainly worth trying.  On the down-side, I haven’t been able to integrate the Pinterest PinIt button into the blog along with the other social sharing buttons.  Their button doesn’t seem to work with the Squarespace platform I use for the blog.

I am absolutely looking for feedback, so please leave your thoughts in the comments.

Cheers!