About
Randy Krum
President of InfoNewt.
Data Visualization and Infographic Design

Infographic Design

Infographics Design | Presentations
Consulting | Data Visualizations

DFW DataViz Meetup

Join the DFW Data Visualization and Infographics Meetup Group if you're in the Dallas/Fort Worth area!

Search the Cool Infographics site

Custom Search

Subscriptions:


Feedburner

The Cool Infographics® Gallery:

How to add the
Cool Infographics button to your:

Cool Infographics iOS icon

- iPhone
- iPad
- iPod Touch


Read on Flipboard for iPad and iPhone

Featured in the Tech & Science category

Flipboard icon

Twitter Feed
From the Bookstore

Caffeine Poster

The Caffeine Poster infographic

Entries in world (200)

Thursday
Oct212010

Top 10 Most Expensive Cities to Live In 2010


I like this one, Top 10 Most Expensive Cities to Live In 2010, from www.homeloanfinder.com.au (Australian Mortgage Broker). $27 for a fast food meal?  $7,000 rent?!?

Love the city icons; they’re easier to recognize than the flags.  My only complaints are that the image sizes in the comparison table don’t look quite right.

Thanks to Fred for sending in the link!

Tuesday
Oct192010

Video: Hans Rosling: The good news of the decade?

I love the Hans Rosling videos from TED.  This new video “The Good News of the Decade?” comes from TEDxCHANGE in Sep 2010.

Hans Rosling reframes 10 years of UN data with his spectacular visuals, lighting up an astonishing — mostly unreported — piece of front-page-worthy good news: We’re winning the war against child mortality. Along the way, he debunks one flawed approach to stats that blots out such vital stories.

I love how passionate and excited he gets about statistics!

Thursday
Sep302010

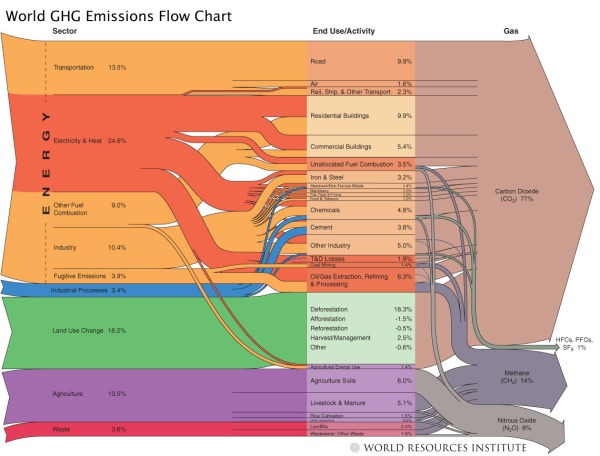
World GHG (Green House Gasses) Emissions Flow Chart

From the World Resources Institute, the World GHG Emissions Flow Chart needs a new name, but shows the composition of GHG (Green House Gasses) emissions and where they come from.

Sources & Notes: All data is for 2000. All calculations are based on CO2 equivalents, using 100-year global warming potentials from the IPCC (1996), based on a total global estimate of 41,755 MtCO2 equivalent. Land use change includes both emissions and absorptions; see Chapter 16. See Appendix 2 for detailed description of sector and end use/activity definitions, as well as data sources. Dotted lines represent flows of less than 0.1% percent of total GHG emissions.

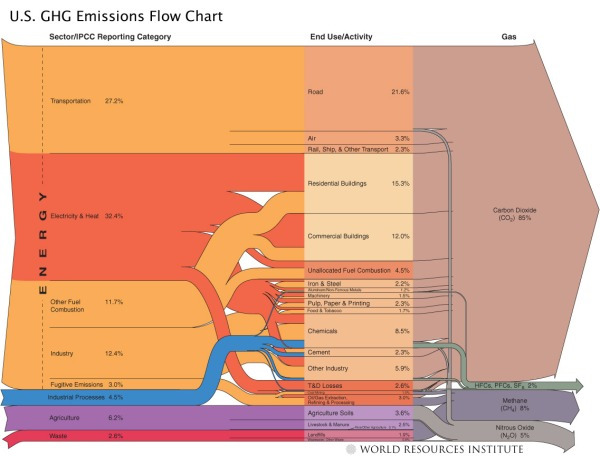
They also have this one for just U.S. GHG emissions:

Found on Data Mining: Text Mining, Visualization and Social Media

Friday
Sep172010

An Infographic Guide to Buying Your Own Island


Posted on iglucruise.com, The Guide to Buying Your Own Island is a great visual explanation of where they are and how much an island would cost.

Ever wondered how to own your own private island? With many of major cruise lines now owning their own white sandy beaches in the Caribbean here is a look into how we can own our own paradise too.


Wednesday
Sep082010

The Most Widely Spoken Languages of the World

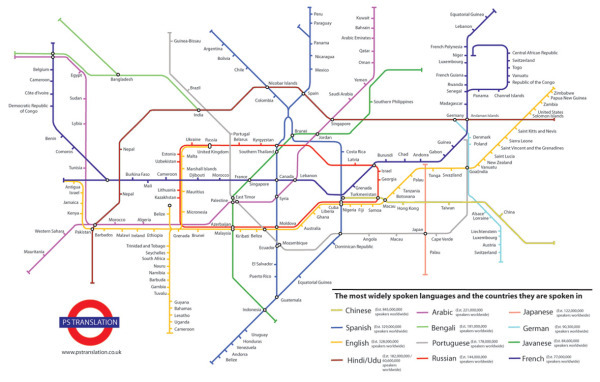
A subway map style infographic, The Most Widely Spoken Languages of the World, shows some of the primary countries and the languages they speak.  Each track is a different language, and the connection point are countries where that language is one of the dominant languages.  The actual number estimates behind how many people speak each of the top languages is listed in the legend.

I don’t know how accurate it is because the data source isn’t listed.  I would think that the U.S. would at least be a junction point between English and Spanish (and maybe others).

This infographic illustrates the most widely spoken languages in the world and some of the countries these languages are spoken in.  The station name indicates the language and the number of speakers that languages has and the map illustrates some of the countries these languages are spoken in.  The list of countries is not exhaustive but can help the viewer navigate the world of languages.
The inspiration for this map came from the London Underground map – which in fact is not a map but a schematic diagram. As a schematic diagram it shows not the geographic but the relative positions of stations along the lines, stations’ connective relations with each other and their fare zone locations.

This infographic has been commissioned by PS Translation to showcase their range of
translation services.

I also think this is a fantastic example of a infographic used for marketing purposes.  It’s not an outright advertisement, but it is certainly a related topic to a translation service done in a very appealing design style.

Thanks for the link James!

Friday
Jul022010

The 2010 Internet Censorship Report infographic


From Antonio Lupetti at WoorkUp.com, The 2010 Internet Censorship Report looks at how many people in the world population are effected by government censorship.

It is one of the tools used by governments to filter out unwanted information and to prevent the spread through the World Wide Web. It is a phenomenon of staggering proportions that affects over 25% of the global population.

My suggestion for improvement is that I think the the white circles representing the countries should be sized in accordance the population numbers.

Thanks to Antonio for sending in the link.

Tuesday
Jun292010

How Wild is North America? (infographic)

How Wild is North America? is an infographic from TheBigWild.org.

Infographics really come in handy when you want to highlight fun facts and empirical  evidence as it relates to scale and impact.

The Big Wild infographic features biodiversity in North America and compares Canada to the United States and Mexico.

Thanks to Alain for sending in the link!

Wednesday
Jun162010

The Shocking Disparities of Labor Cost (infographic)


From Fixr.com, The Shocking Disparities of Labor Cost visualizes how long it takes to earn the annual U.S. Minimum Wage from countries around the world.

My only criticism is that the change in area of the triangles doesn’t match the increase in time for the different countries.  The scale of the visuals doesn’t match the numbers.

Thanks to Andres for sending in the link!

Wednesday
Jun092010

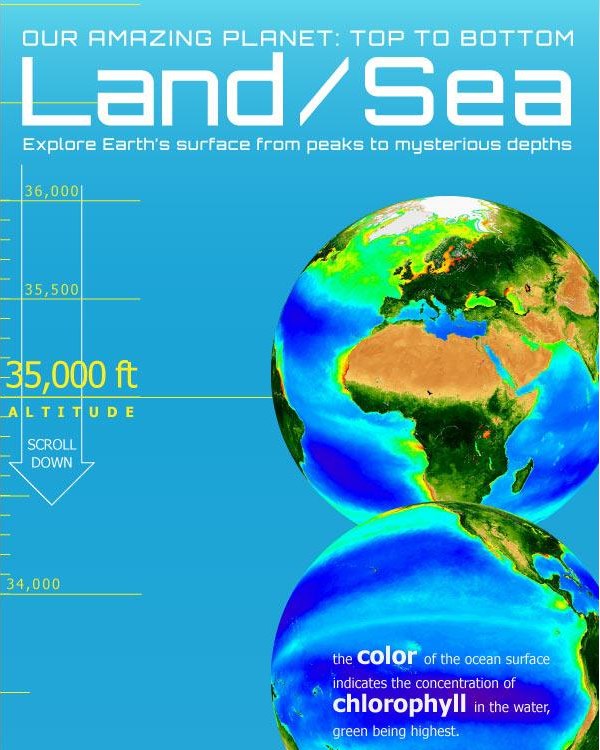
Our Amazing Planet: Top to Bottom infographic


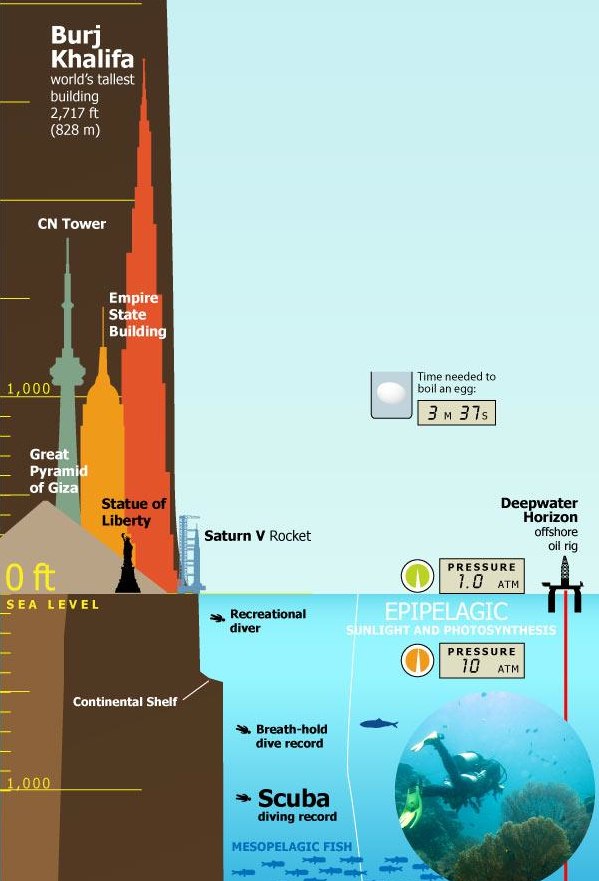
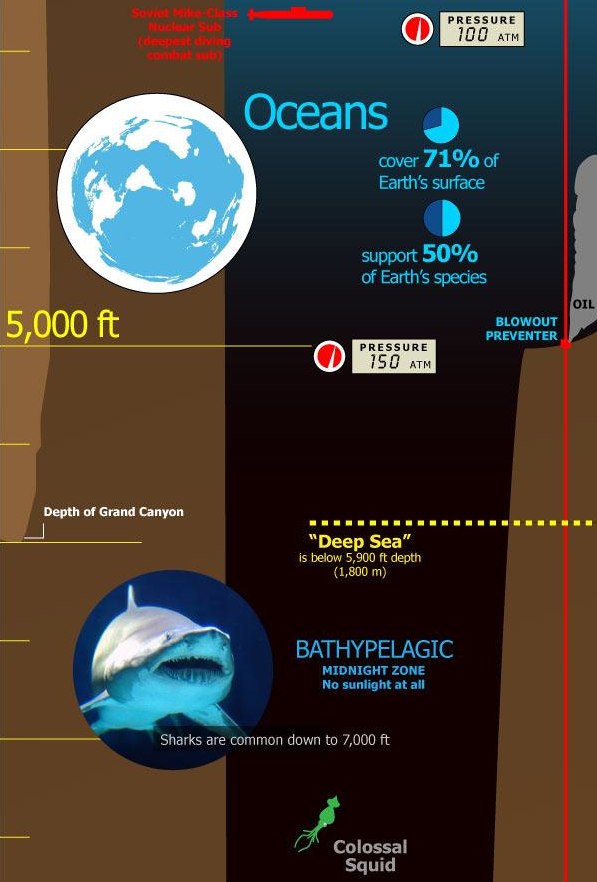
Designed by Karl Tate, Our Amazing Planet: Top to Bottom is a cool infographic that looks at the scale of things from the upper atmosphere to the deepest ocean depths.


The infographic is HUGE (14,677 pixels tall), and that keeps it accurate to the scale.  It’s unreadable when the entire infographic is viewed on the screen, and that adds to the readers grasp of how big this scale really is.


It’s also timely with recent events, showing the depth of the Deepwater Horizon oil rig spill, and drilling depth.  You can view the entire image on OurAmazingPlanet.com.


Tuesday
May182010

Crude Awakening - Gulf Spill Infographic

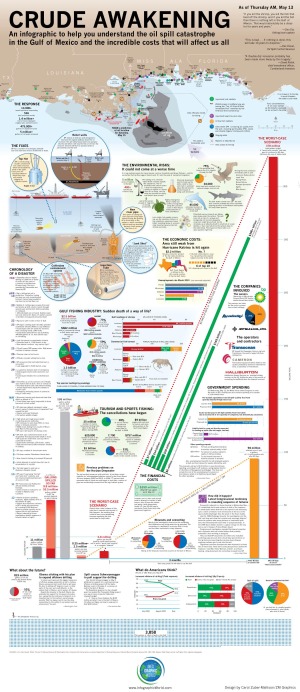
This is a very comprehensive, detail-heavy infographic designed by Carol Zuber-Mallison at ZM Graphics for InfographicsWorld.com.  Including map data, a timeline, a few pie and bar charts, a schematic of the different fix scenarios and a visual of almost 4,000 squares.

“I usually do print work; this is my first piece specifically for social media.  It just kept getting bigger and bigger as things continued to get worse in the Gulf.

I built it in four frantic days.  There’s some things O would have done differently but when you’re working that fast you’re just putting stuff together with prayer and duct tape.  Design takes a back seat to trying to get the information right.

This is an ongoing news event so things are constantly changing and I hope to update it at least once a week.  (If you’ve found an error, please e-mail me so I can fix it.)”

— Carol Zuber-Mallison

Thanks to Justin Beegel from InfographicsWord.com for sending in the link!