About
Randy Krum
President of InfoNewt.
Data Visualization and Infographic Design

Infographic Design

Infographics Design | Presentations
Consulting | Data Visualizations

DFW DataViz Meetup

Join the DFW Data Visualization and Infographics Meetup Group if you're in the Dallas/Fort Worth area!

Search the Cool Infographics site

Custom Search

Subscriptions:


Feedburner

The Cool Infographics® Gallery:

How to add the
Cool Infographics button to your:

Cool Infographics iOS icon

- iPhone
- iPad
- iPod Touch


Read on Flipboard for iPad and iPhone

Featured in the Tech & Science category

Flipboard icon

Twitter Feed
From the Bookstore

Caffeine Poster

The Caffeine Poster infographic

Entries in charts (150)

Thursday
Apr152010

The Feltron Annual Report 2009 and an Online Class April 29th

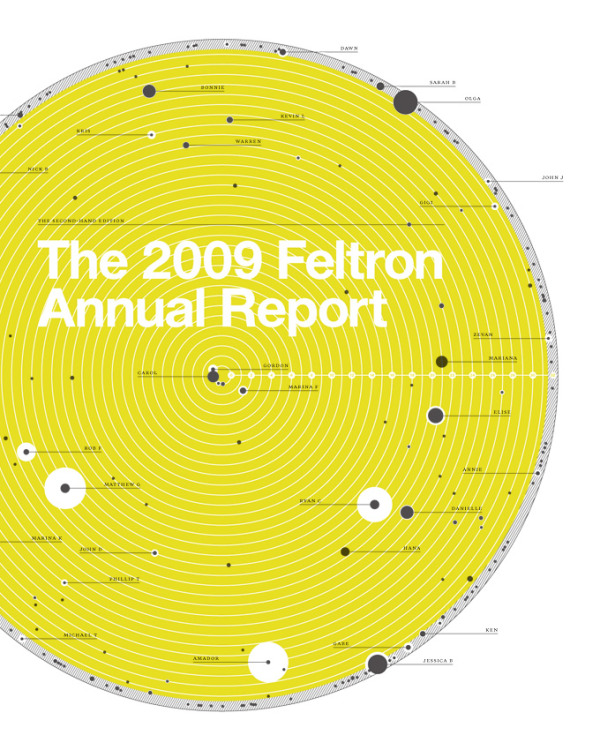
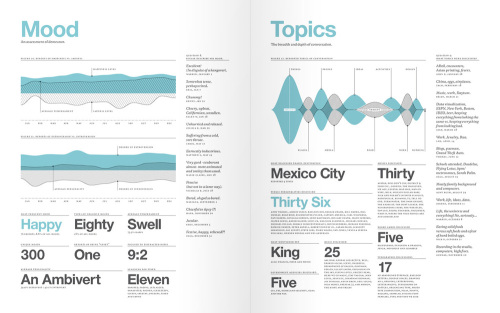
I’m not sure how it slipped off the radar, but I haven’t posted a link to the Feltron Annual Report 2009 here on the blog yet.  Nicholas Feltron has done infographics for Time, CNN, Wired, New York Times, Fast Company and more, but probably his most popular infographics are his annual reports.  The print version of the Feltron Annual Report 2009 is available for pre-order for $30 from the Feltron Store.

Mike Aruz interviewed Nicholas Feltron when the 2009 Annual Report was released on mikearauz.com

The reason this came up today is that Nicholas is going to be the host of Live DesignCast: Nicholas Felton, A Master Class on Information Design.  This is an online class from PRINT Magazine on April 29, 2010 at 4pm EST.  The class costs $69 and is one hour long.

Our current information age has produced an inevitable crush of complicated data to sort through. Thankfully, there is a rising group of designers who present all this data in a way that we can understand and use. And for the last several years, no one has done it better than Nicholas Felton. 

In this Master Class, Felton explains how detailed data leads to better stories, offers a few guidelines for displaying complicated data sets, and challenges you to use all five senses through the process. 

In this Master Class DesignCast, you’ll learn: 

• How to visualize large data sets
• How to go from an initial question to gathering, comparison, and display 
• How to use sensors, whether hardware or software, to gather data
• How data helps satisfy curiosity, provides insight, and entertains
• How better data leads to better stories

Thursday
Feb112010

Tableau launches FREE Tableau Public today!


Today, Tableau Software launched a data visualization package for websites called Tableau Public.  This package is intended to be used be anyone with a website to embed visualizations on their own sites.

Tableau Software today launched a new product that brings public data to life on the web. Tableau Public, available for free, lets anyone who posts content to the web easily create interactive visualizations and publish them to blogs, web sites, Twitter feeds or anywhere online. Instead of viewing static charts or tables, Tableau Public lets people answer questions and share data interactively on the web. 

The visual above was created using Tableau Public to demonstrate its capabilities, but you’ll notice that I’ve been able to embed it here on Cool Infographics as well.  The visualizations created allow users to share, embed and link to your graphics from anywhere…making them social!

They’re also interactive and linked together.  For example, click on the Bronx in the data above, and all of the visuals will highlight just data related to the Bronx.  The map even adjusts to only focus on the Bronx.

About the NY City Graffiti visual:

Looking borough by precinct across The Big Apple, one can quickly see that there are some differences in how graffiti is handled. For instance, Staten Island has very little graffiti, but the graffiti they do have lingers without cleanup for almost twice the citywide average. On the other side of the spectrum, Manhattan has over 2000 incidents of graffiti, but it is cleaned up in less than 17 days on average.

Look for more features from Tableua Public here in the future as I experiement and play with it.

Thanks to Elissa at Tableau Software for the link and information!


EDIT:  Here’s a news video as part of the announcement.  Thanks Adriana!

Friday
Jan082010

16 Infographic Resumes, A Visual Trend

(It’s actually up to 18 now.)
A number of designers have attempted to design a visual, infographic resume, and while this is certainly not mainstream (yet), it is gaining some momentum.  I wanted to highlight some of the great examples available on the web, but the line between an infographic resume and a designer resume is tough not to cross.  I’ve tried to stay true to only infographic versions here, and didn’t include many good illustrated resumes that didn’t include any visualizations.


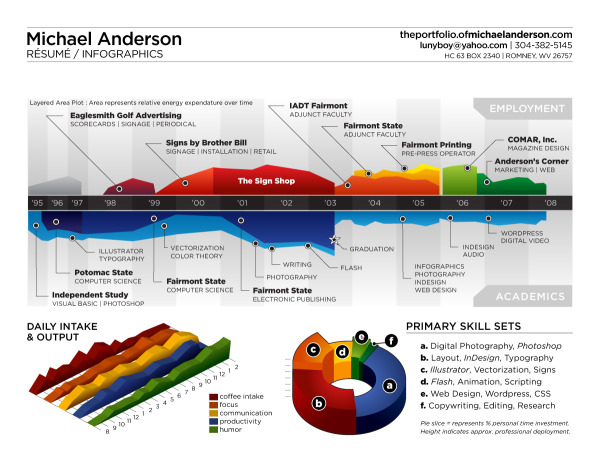
Michael Anderson’s 2008 concept on an infographic resume (above) is probably the most well known.  It’s been tweeted, dugg, reddit-ed and featured on FastCompany.com.

I decided to update my résumé with a different perspective on the typical time-line theme. This is just concept art, as there are almost no real metrics represented except for time. There is no energy expenditure unit of measure, nor tics to delineate percentage or otherwise.

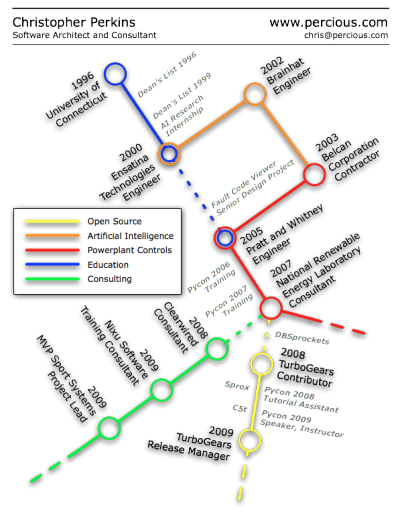
Christopher Perkins’ resume, using the subway map metaphor.
I do agree it’s more of an overview and less of a project-experience-oriented resume, but I’ve been thinking a lot about (and looking at) resumes lately, and I feel like what you really need to do is grasp someone’s attention first. This is whyhttp://www.percious.com is listed at the top, and that’s about all listed (no address, phone number, etc.) The other thing I was thinking about doing was to add an image map with links to provide more information about the things I have worked on.
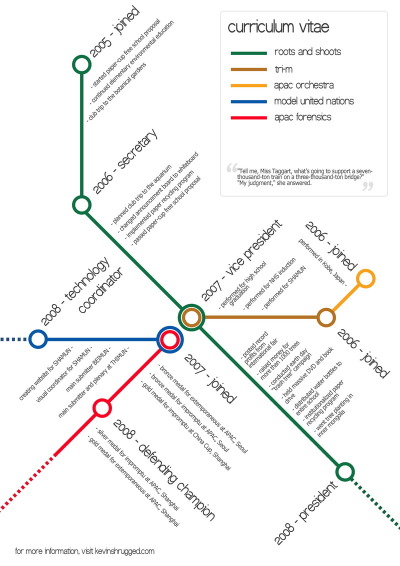
 

Also using the subway map metaphor, Kevin Wang plots out his activities during his school years.

 

Curriculum Vitae, by Uito2 in 2007, shows his experience level in different software packages as progress bars.
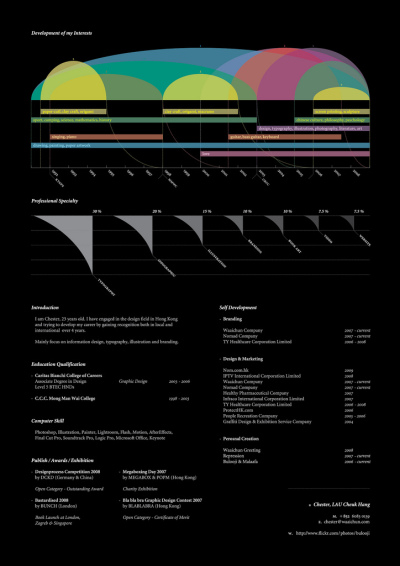
 

Chester, Lau Cheuk Hang, does a great job utilizing a timeline at the top of his resume with spanning arcs to highlight time spent in different activities.
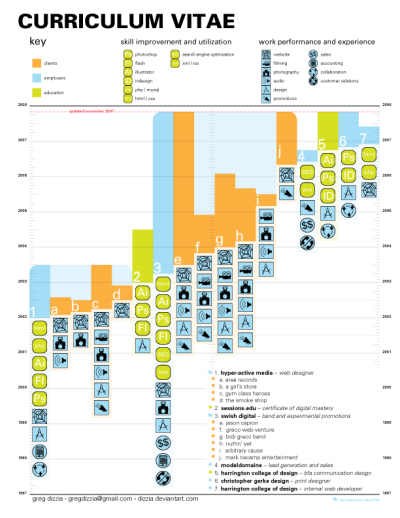
Greg Dizzia also creates a Curriculum Vitae showing vertical bars spanning a timeline for each company, and adds an additional element of icons to represent different experiences during each project.

This lists my history in the design world (some lesser clients have been left out) - Designed using univers exclusively. This is an appendage to a traditional resume, to be included as a forward page in my portfolio.
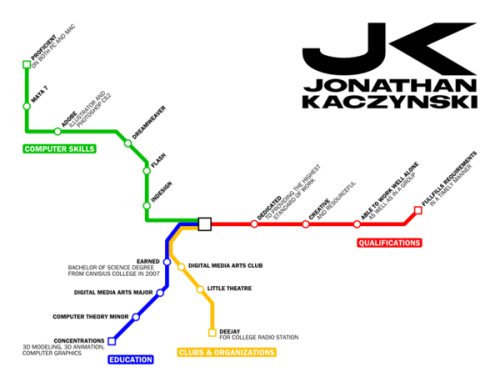
Jonathan Kaczynski, also tries a subway map style using the different lines as categories instead of attempting a timeline.  I actually think this approach works a little bit better, the timeline versions appear difficult to translate into a subway map.

I am currently in the process of remaking my portfolio. It will have the appearance of a mass transit system’s website. This is the resumé that I’m working on to go along with the portfolio. It still needs a bit of clean-up and and logo needs some work.
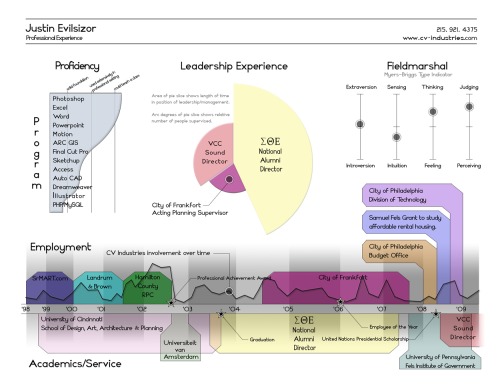
 

Justin Evilsizor’s version incorporates a timeline, a level-of-skill chart and I personally love the addition of the Meyer’s-Briggs Type Indicator.
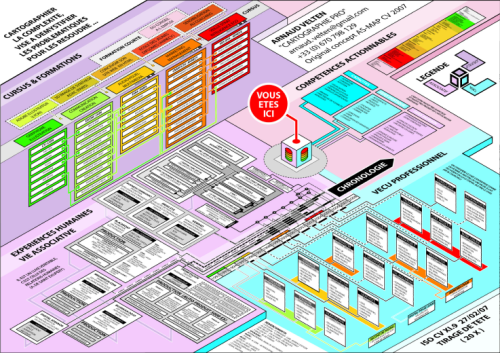
 

Arnaud Velten, Cartographer of Complexity, created this isometric resume.  At its heart is a timeline, but he has added an incredible amount of detail to each of his skills.  Seems like too much detail for me, but that may be what he wants to convey.
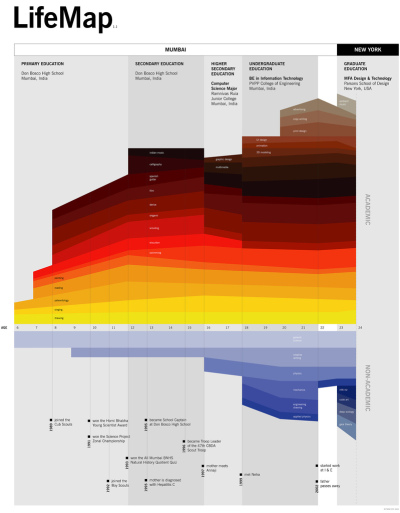
 

Maybe not technically a resume, Ritwik Dey’s Life Map is an impressive timeline of his education and activities.

This information design piece maps out my interests between ages 6 and 24 and the context in which they were born and nurtured. It also brings to surface how these interests influenced and were in turn influenced by milestones in my personal journey.


Stephen Gates’ resume is very clean a take on the timeline.

Why did no one try something new? Why wasn’t there one designer who took on their resume as design challenge to do something visual and different? I also realized that I was just as guilty as everyone else so I set out to design something different. So after some work in my spare time I have the design shown above (click on it to see it full sized). It is just a start and it feels like it is heading in an interesting direction but let me know what you think.
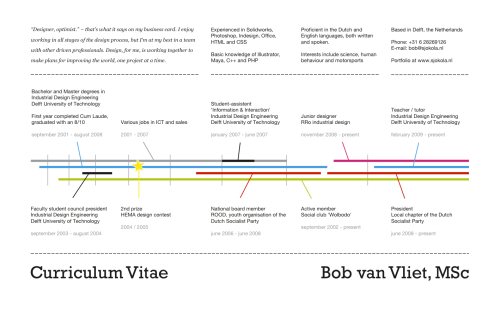
 

Bob van Vliet also created a very clean timeline resume.

I thought I’d try something different from the standard A4 with a dull summary of positions.  Four timelines represent the most important parts of my life so far: Work, Education, Activism and Fun. The years get wider towards the present as those say more about who I am now than when I just started university.
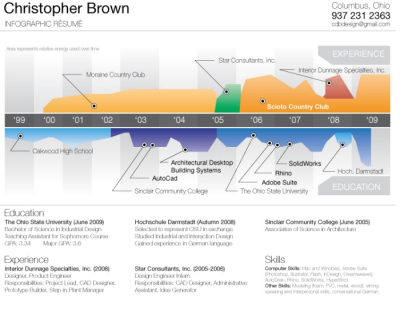


Christopher Brown’s colorful infographic timeline inspired by Michael Anderson’s concept.
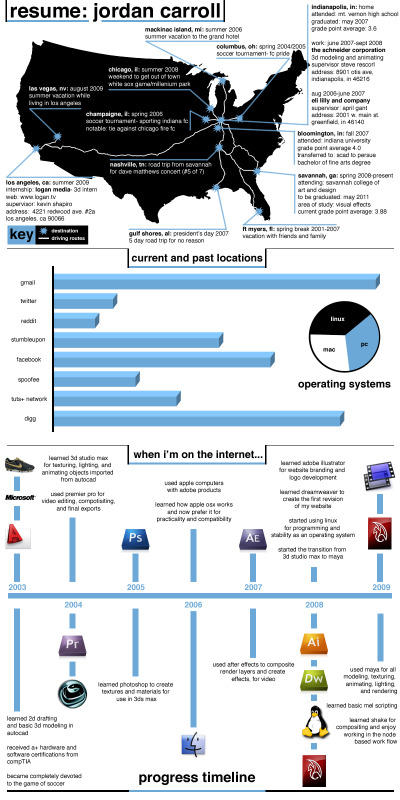


Jordan Carroll’s resume includes a few different elements.  Timeline, map and charts combine into one overall resume.
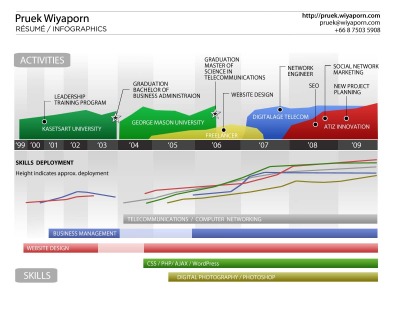
 

Another colorful timeline resume, this one by Pruek Wiyaporn, also appears inspired by Michael Anderson’s concept.
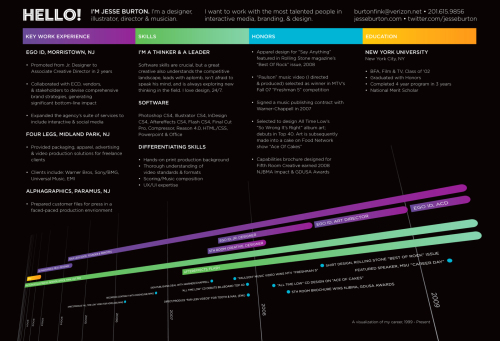
 

Jesse Burton also has a very nice stylized timeline resume.


Which ones do you like?  Have I missed any other good ones out there?

Thanks to links found on VisualThinkMap, FastCompanyPatrick Debois


EDIT: Here are a few more that I missed when I originally wrote the post:
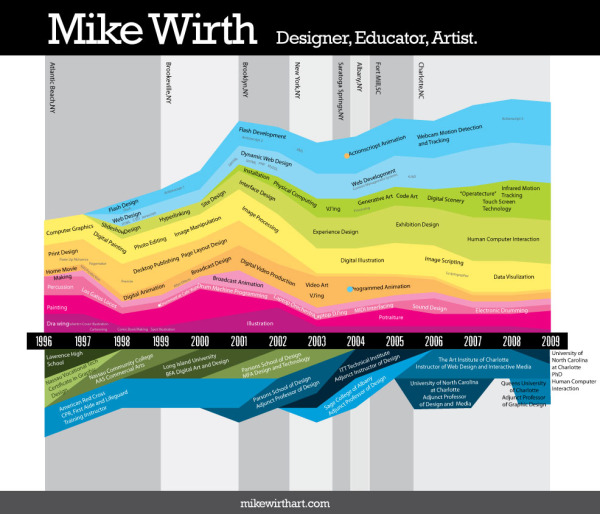
 

Mike Wirth is a freelance infographic designer.  His colorful timeline has experiences above the X-axis, education is below and his geographic locations are the shaded bars in the background.  When he learned specific software packages is also identified in the colored area, which shows how long he has been using the different software packages.
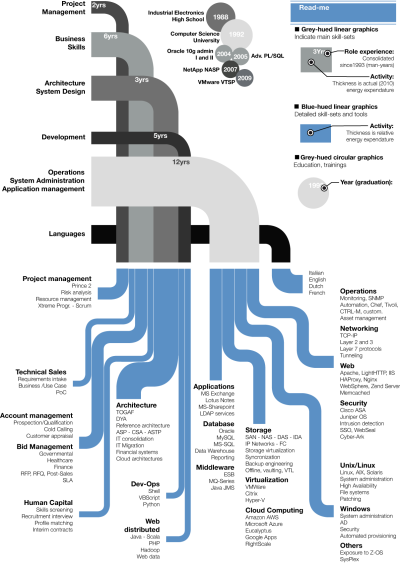
 

Gabriele Bozzi designed this resume concept that focuses totally on skills and experience.  Education is identified in the small bubbles, and the skills are connected to specific examples of her experience.  She is working on a separate timeline graphic.

Wednesday
Jan062010

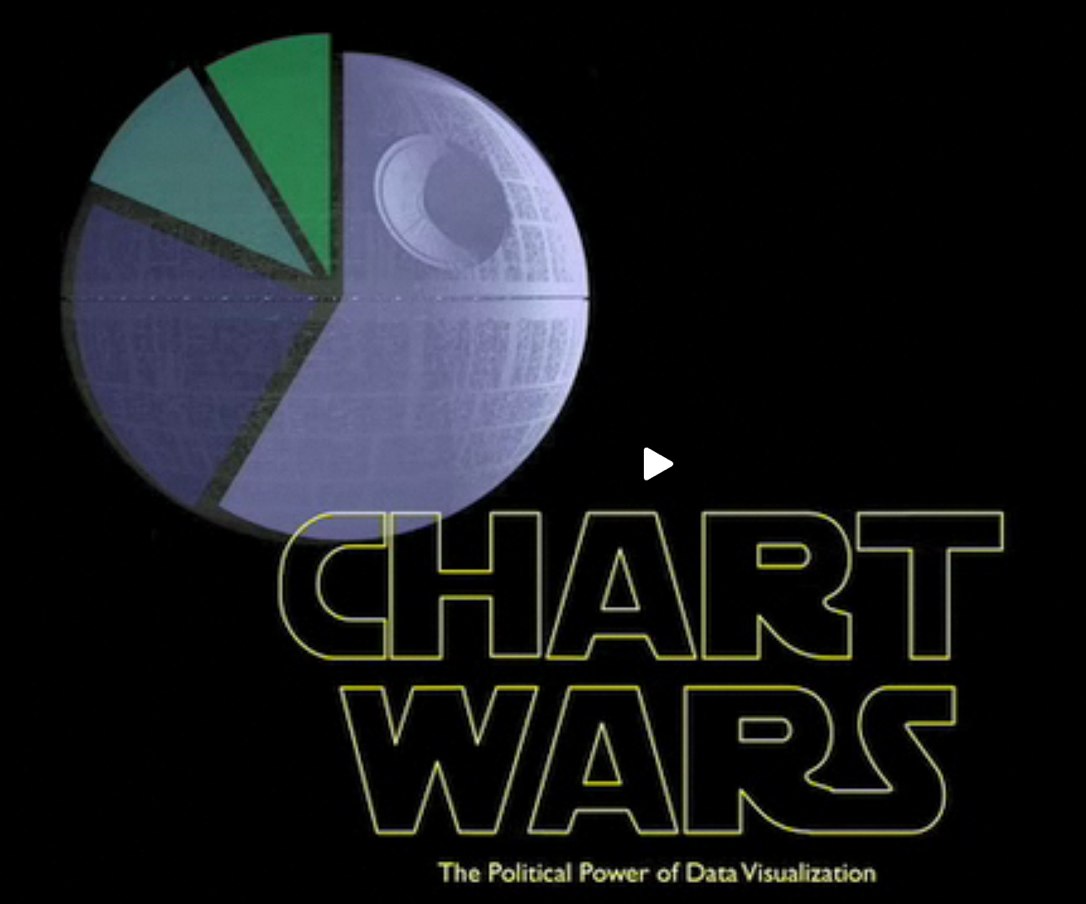
Chart Wars: The Political Power of Data Visualization

Chart Wars is a great, short (5:15) presentation by Alex Lundry on the political power of data visualization and some of the issues surrounding using charts and infographics to promote a specific agenda.  Inspired title slide too.  Nice job Alex!

TargetPoint’s VP and Director of Research, Alex Lundry, was recently a featured speaker at DC Ignite, an evening of short presentations in which participants are limited to 5 minutes and precisely 20 slides that auto-advance every 15 seconds.


Thanks to Dave Gray for tweeting a link!

Monday
Dec282009

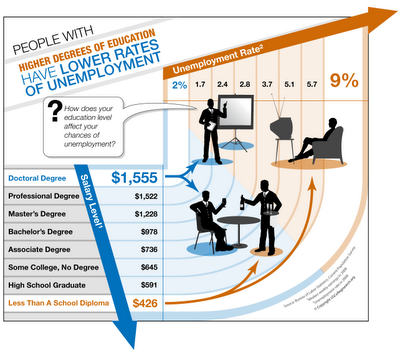
Higher Education = Lower Unemployment


From USCollegeSearch.org, a fairly simple but good chart showing the relationship between unemployment rates and education levels.  Although lacking a good title, this chart does a great job of communicating one message really well.

The Bureau of Labor Statistics has found that people who finish degree programs in college earn much more over the course of their lifetimes than those who only earn high school diplomas or drop out of college. Sometimes the difference can be over a million dollars before retirement.  But even more interesting, it was noted that people with undergraduate and graduate degrees manage to stay employed for longer periods, but also find jobs they qualify for more quickly.  They spend less time searching and more time working.


Thanks Jim!

Thursday
Dec172009

The Simpsons 20th: Comedy [Family] Tree


The Simpsons celebrate their 20th anniversary this week on Thursday, and CNN Entertainment published this chart "The Simpsons Comedy Tree" on Monday.  A combination Nightingale Rose Graph (also called a polar area diagram), family tree and timeline, this simple chart connects the influences that impacted Matt Groening and the creators of the Simpsons as well as the shows that came after.
"The Simpsons" stands on the comedic shoulders of many that came before -- and has influenced countless works that have arrived since. Here are just a few of the roots of the "Simpsons" comedy tree and the branches of those it gave life to. (The following, illustrated by the doughnut at the top of the story, is by no means complete, and each member has its own, sometimes overlapping influences.) 
Thanks to Tony Hendra's "Going Too Far" for inspiration and cartoonist Art Spiegelman for having his fingerprints all over the place.
The article also includes descriptions of the actual influence for each of these shows.

Thanks for the link Matt!

Also:


For those Simpsons fans of you, here is also the poster created exclusively for Entertainment Weekly celebrating the release of the 20th season DVD set on Jan 12.  Dude, make sure to go look at the large, scrollable version.

Wednesday
Nov252009

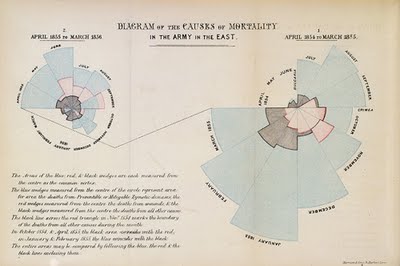
Florence Nightingale: Causes of Mortality infographic from 1858!


Yes, from that Florence Nightingale (1820-1910), and it's from 1858!  The polar area diagram is also known as the Nightingale Rose Graph.

From Wikipedia,
This "Diagram of the causes of mortality in the army in the East" was published in Notes on Matters Affecting the Health, Efficiency, and Hospital Administration of the British Army and sent to Queen Victoria in 1858.


This graphic indicates the number of deaths that occured from preventable diseases (in blue), those that were the results of wounds (in red), and those due to other causes (in black). 
The legend reads: 
The Areas of the blue, red, & black wedges are each measured from the centre as the common vertex. The blue wedges measured from the centre of the circle represent area for area the deaths from Preventable or Mitigable Zymotic diseases, the red wedges measured from the centre the deaths from wounds, & the black wedges measured from the centre the deaths from all other causes. The black line across the red triangle in Nov. 1854 marks the boundary of the deaths from all other causes during the month. In October 1854, & April 1855, the black area coincides with the red, in January & February 1855,(*) the blue coincides with the black. The entire areas may be compared by following the blue, the red, & the black lines enclosing them.
Also from Wikipedia:
Florence Nightingale had exhibited a gift for mathematics from an early age and excelled in the subject under the tutorship of her father. Later, Nightingale became a pioneer in the visual presentation of information and statistical graphics. Among other things she used the pie chart, which had first been developed by William Playfair in 1801.
Florence Nightingale is credited with developing a form of the pie chart now known as the polar area diagram, or occasionally the Nightingale rose diagram, equivalent to a modern circular histogram to illustrate seasonal sources of patient mortality in the military field hospital she managed. Nightingale called a compilation of such diagrams a "coxcomb", but later that term has frequently been used for the individual diagrams. She made extensive use of coxcombs to present reports on the nature and magnitude of the conditions of medical care in the Crimean War to Members of Parliament and civil servants who would have been unlikely to read or understand traditional statistical reports.
In her later life Nightingale made a comprehensive statistical study of sanitation in Indian rural life and was the leading figure in the introduction of improved medical care and public health service in India.
In 1859 Nightingale was elected the first female member of the Royal Statistical Society and she later became an honorary member of the American Statistical Association.
Found this while reading the great FlowingData post "9 Ways to Visualize Proportions – A Guide" by Nathan Yau.

KXVTA2R4XWE3
FRJK52DWMBJQ

Friday
Oct302009

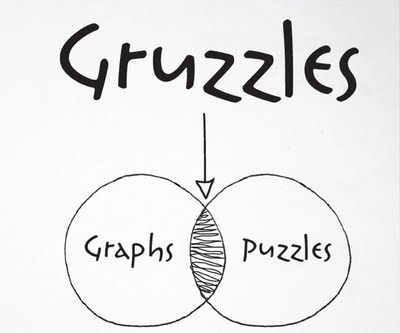
What's a Gruzzle?


So, what's a Gruzzle?  With extensive use of Venn Diagrams, GL Hoffman often posts these visual blog posts on his blog, What Would Dad Say, and Fast Company has also started pubishing them as well.


So back to the original question, What's a Gruzzle?  Here's a really good answer, by one of his readers:


But here's the official answer:


You can also follow @GLHoffman on Twitter

Wednesday
Oct282009

A Graphic History of Newspaper Circulation


From The Awl, this certainly isn't the prettiest infographic I've ever seen (it's basically just a line chart), but it tells it's story to the viewer very well.  Maybe there are times when a simple chart from Excel can do the job...NAH.   From a title that proclaims "A Graphic History of Newspaper Circulation" we certainly expect much more visual information.

I'm sure many of the graphic designers reading this blog could turn this data into a significantly better infographic (hint, hint...).

Every six months, the Audit Bureau of Circulations releases data about newspapers and how many people subscribe to them. And then everyone writes a story about how some newspapers declined some amount over the year previous. Well, that's no way to look at data! It's confusing—and it obscures larger trends. So we've taken chunks of data for the major newspapers, going back to 1990, and graphed it, so you can see what's actually happened to newspaper circulation. (We excluded USA Today, because we don't care about it. If you're in a hotel? You're reading it now. That's nice.)
Some surprising trends: the New York Post has the same circulation it had two decades ago! Also, the once-captivating battle of the New York City tabloids has become completely moot.
Some unsurprising trends: the Los Angeles Times is an absolute horrorshow. Not shown: the Boston Globe disappearing off the bottom of this chart, in a two decade decline from 521,000 in 1990 to 264,105 this year.
Found on Daring Fireball.

Wednesday
Oct212009

Circular Periodic Table of the Elements


Mohd Abubakr has redrawn the classic periodic table in a circular pattern to improve the proximity and relationships between the elements.
So why change it? According to Mohd Abubakr from Microsoft Research in Hyderabad, the table can be improved by arranging it in circular form. He says this gives a sense of the relative size of atoms--the closer to the centre, the smaller they are--something that is missing from the current form of the table. It preserves the periods and groups that make Mendeleev's table so useful. And by placing hydrogen and helium near the centre, Abubakr says this solves the problem of whether to put hydrogen with the halogens or alkali metals and of whether to put helium in the 2nd group or with the inert gases.
The strongest feedback about the new circular table is that you have to rotate it to read it.  Kind of a problem when you print a poster and post it in a classroom or a laboratory.  Although I think it's an easy thing to remedy by changing the orientation of the text.

Original post on Technology Review by MIT, and found on VizWorld by Randall Hand.

Page 1 ... 5 6 7 8 9 ... 15 Next 10 Entries »