About
Randy Krum
President of InfoNewt.
Data Visualization and Infographic Design

Infographic Design

Infographics Design | Presentations
Consulting | Data Visualizations

DFW DataViz Meetup

Join the DFW Data Visualization and Infographics Meetup Group if you're in the Dallas/Fort Worth area!

Search the Cool Infographics site

Custom Search

Subscriptions:


Feedburner

The Cool Infographics® Gallery:

How to add the
Cool Infographics button to your:

Cool Infographics iOS icon

- iPhone
- iPad
- iPod Touch


Read on Flipboard for iPad and iPhone

Featured in the Tech & Science category

Flipboard icon

Twitter Feed
From the Bookstore

Caffeine Poster

The Caffeine Poster infographic

Entries by Randy (1654)

Tuesday
Jun212011

Foursquare Reaches 10 Million Users


Foursquare yesterday announced that they have reached 10 Million members, and released this infographic for the occasion.

And, to commemorate this pretty crazy occasion, we put together a little infographic. Be sure to click through to see it bigger; if you’re anything like us, watching the full-size animated map puts butterflies in your tummy. Thank you so much for supporting us!

I love the animated portion right in the middle!

Personally, I have mostly given up on Foursquare check-ins without the points or mayorships earning anything for me.  I wonder how many of those 10 Miliion joined, but don’t use Foursquare anymore?

Monday
Jun202011

Drunk Driving by the Numbers


The Real Effects of Drinking and Driving is a good infographic from CarInsuranceComparison.org.  It stays focused and tells one compelling story really well.  Some of the illustrations are just that, illustrations, when they could have visualized the numbers.

Thanks to Clyde for sending in the link!

Thursday
Jun162011

The Business of Giving


The design of The Business of Giving from SocialCast does a good job of walking the reader through a story about companies donating to charities.  However, they could have done more to visualize the scope of donations instead of just including the dollars values in text.

In the Popular Causes section, I would have built the icons right into the pie chart.  They don’t serve much purpose on their own next to the chart.

I love the puzzle piece images used for Partnerships.

Designed by Column Five Media

Wednesday
Jun152011

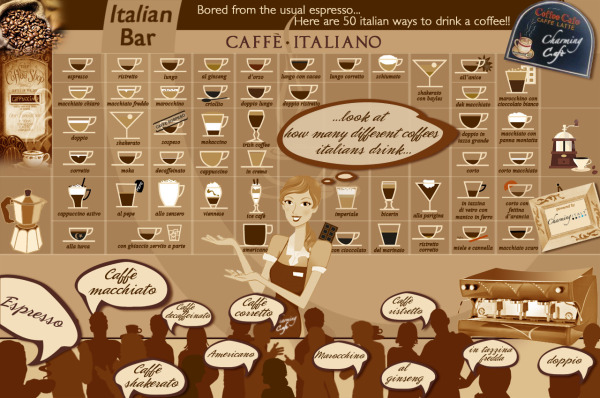
Caffรจ Italiano: 50 Types of Italian Coffee


Caffè Italiano is another mouth-watering infographic from CharmingItaly.com.  I love how they took what could have been a standard drink ingredients visualization one step further and designed it as a menu board for an Italian coffee bar.

For Italians, coffee break is a sort of ritual in which the conviviality is a key point. Around a good coffee you can have a chat, take a few minutes for yourself and relax. It’s not just about inserting something into the stomach.

For Italians, drinking a good coffee is a pleasure: it is something to be sipped and not to be swallowed down; it is something to relish in the fullness of its flavour.

This is why a bad coffee gets Italians in a bad mood, while a good coffee can make their day!

When you enter an Italian Bar, around the clock, pay attention on what’s around you: we bet you won’t find 10 people ordering the same type of coffee!

The types of coffee in the Infographic are written in Italian, so you will be able to order them in the right way at the Bar!

The only problem is that there isn’t any guide or legend for the reader to understand the meaning behind the different colored portions of each drink.  They look carefully designed to be accurate to the how the drinks are mixed, but that effort is lost without an explanation.

Thanks to Paolo for sending in the link!

Tuesday
Jun142011

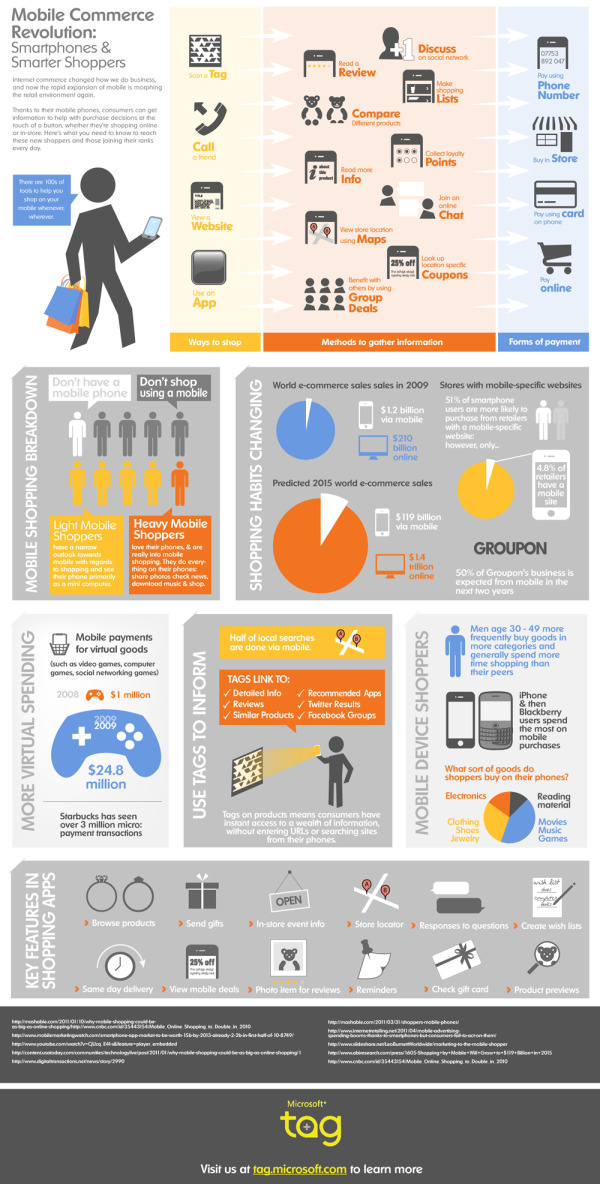
Microsoft: The Mobile Commerce Revolution


The Microsoft TAG team has released a new infographic focused on intelligent shoppers.  Mobile Commerce Revolution: Smartphones & Smarter Shoppers looks at the data behind how we use our smartphones to compare prices, look-up coupons, make purchases with our phones and more.

This is a very busy infographic, with some great data hidden inside.  I like the visuals and the isotype style, but there isn’t a cohesive story or clear path for your eye to follow.  The e-commerce sales growth from 2009 to 2015 is a huge data point and should be much more prominent.

Thanks to Nick for sending in the link!

Friday
Jun102011

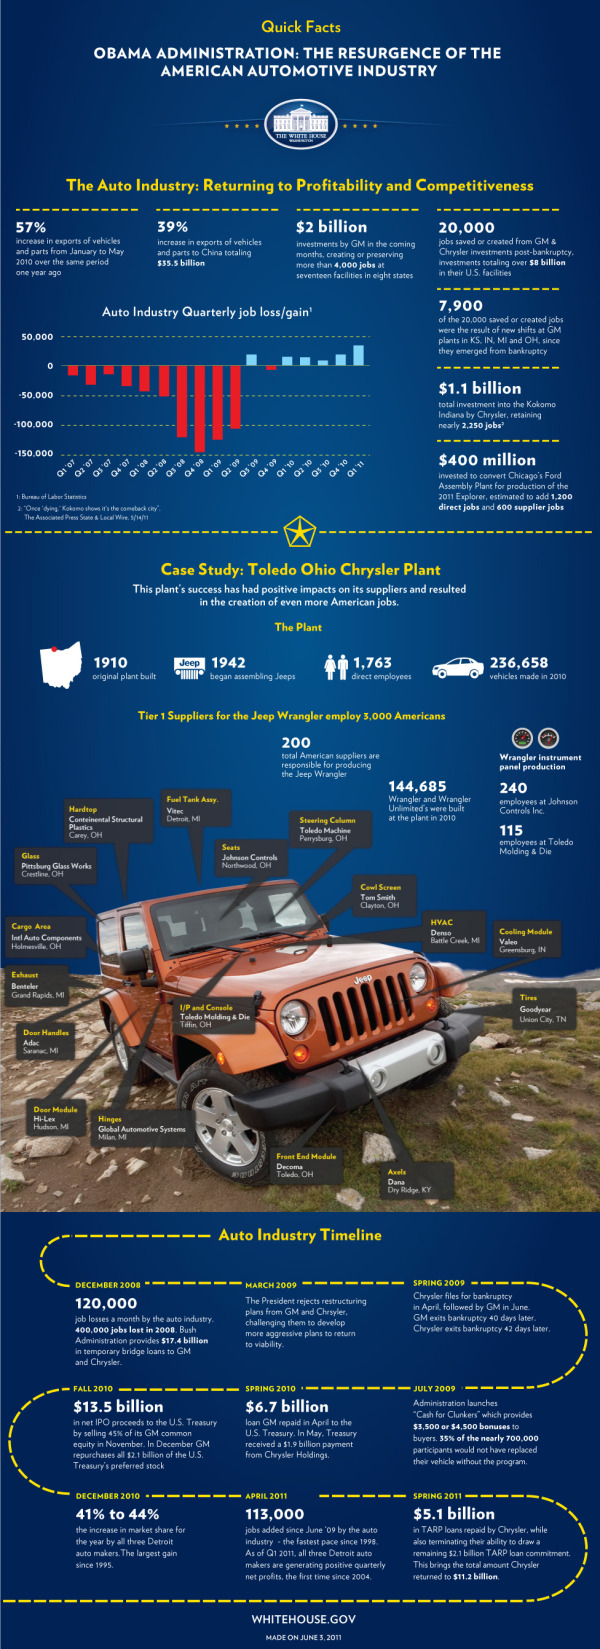
White House Infographic: The Resurgence of the American Automotive Industry


The team at the White House released The Resurgence of the American Automotive Industry infographic on the White House Blog last week in conjunction with President Obama’s visit to Toledo, OH and the JEEP manufacturing plant there.

Today, President Obama will travel to Toledo, Ohio where he will visit the Chrysler Group’s Toledo Supplier Park – an operation that employs more than 1,700 workers producing Jeep Wranglers, Jeep Liberties, and Dodge Nitros.  Just two years ago, Chrysler was filing for bankruptcy, and President Obama made the tough decision to support the restructuring of the company rather than allow it to fail – which would have cost tens of thousands of American jobs.

Today, Chrysler is repaying its government loans six years ahead of schedule and posted five consecutive quarters of operating profit.  Earlier this week, the National Economic Council released a new report on the resurgence of the American automotive industry.  Over the past two years, the auto industry has added 113,000 jobs - the fastest pace of job growth in the auto industry since 1998.

Check out this infographic that highlights some of the key successes in the auto industry since 2009.

I wrote a long critique of the last White House infographic about Obama’s Energy Plan (The Obama Energy Agenda: The White House attempts an #Infographic).  This one improves on some of the design issues I had with the last one.  I like that the White house is being consistent with the design style, and you can tell at a glance that this one is obviously in the family of official infographics from the White House.

Citing sources is still an issue for these infographics from the White House.  There are two sources cited and referenced, but many more statistics are included without any source.  For example, where does the “39% increase in exports of vehicles and parts to China” come from?  There are many statistics that could have been visualized to reduce the amount of text as well.  Listing a bunch of numbers in bold text doesn’t make for a good infographic design.

I love the inclusion of the Jeep photo with information mapped on top.  Much more interesting and engaging to the reader than what could have been a list of 17 suppliers, and more interesting than plotting them on a map of the U.S.

The timeline is pretty boring.  The dotted line could have been tire tracks, and way too much text that could have been data visualizations.

Thanks to Mary Kaye for sending me the link!

Monday
Jun062011

DataVis Contest from Postgrad and David McCandless

Postgrad.com is sponsoring a data visualization contest using data gathered by David McCandless.  There’s a brand new iPad2 for the winner, and the top 3 will receive signed copies of ‘Information is Beautiful’ by David McCandless.


It Started With A Tweet…

Data journalist and information designer, David McCandless recently gathered data revealing surprisingly low numbers of black students accepted into Oxford and Cambridge.  However, despite being genuinely passionate about the data, David didn’t have time to visualise it himself.  So he posted the following message on Twitter…

We contacted David and offered to put up a prize as a competition for the best visualisation of this data. To our delight, David accepted our offer.

Like David, we feel strongly that this data should be made visible to many. And we’re challenging you to do it.

UPDATE:  Although the initial findings related to the number of black students, there’s a lot of information within the datasets about the ethnic heritage, and socioeconomic background of students attending different institutions.  You are free to pick out whatever story you wish and present it in a visual format.

Enter Now To Win…

It’s easy to enter the competition and you could win:

  • Recognition from our panel of industry experts in journalism, data visualisation and design
  • Your name and work promoted across the web
  • A proud and noteworthy addition to your portfolio, website or CV
  • A full post profiling you and your work, and the design process you followed
  • A signed copy of Information is Beautiful by David McCandless
  • A brand new iPad2

Expert Judges From The BBC, .net Magazine And More…

Assisting David in the judging, we are thrilled to have judges from the BBC, .net Magazine, Tableau Software, Visualising Data, and marketing agency 97th Floor.

The judges will consider a range of criteria including design, effective visualisation, and presentation of the story.

  • Andy Kirk, Founder, Visualising Data Ltd
  • Chris Bennett, President, 97th Floor
  • David McCandless, Author, Information is Beautiful
  • Elissa Fink, VP Marketing, Tableau Software
  • Katherine Mann, Director, Postgrad.com
  • Rob Bowen, Art Editor, .net Magazine
  • Russell Smith, Editorial Development, BBC News

It’s An Open Brief

The competition is based on the data collected by David, and other sources listed within the dataset.  However, you are free to mashup the data with any other source you wish, provided the sources are publicly available and cited in your entry to the competition. 

Your visualisation can be static, moving or interactive

You can include as little or as much text as you like

It can be as simple as a single chart or a full-blown infographic

You’ve A Good Chance of Winning…

People are often put off entering competitions assuming there will be hundreds of entrants. In reality, this is rarely the case. Simply entering really could put you in the running for a prize. 

There’s a brand new iPad2 for the winner. And the top 3 will receive signed copies of ‘Information is Beautiful’ by David McCandless.

Entries from amateurs and newbies are very much welcome. We’d love to see what you come up with.

Remember, it doesn’t have to be a masterpiece. A simple yet effective piece of visualisation could be just the ticket.

And all highly recommended pieces, will receive recognition by our expert panel alongside the winners when results are announced.

Remember The Important Stuff

The competition rules are posted here.

You can grab the data here (be sure to check out the other sources listed within it).

To enter the competition, simply email your visualisation as a jpeg attachment to mark.johnstone@postgradsolutions.com and include your Full Name and the best email address to reach you on. As an alternative to sending your entry as an attachment, you are welcome to post your entry on your own site, and simply send us the link. In fact, we’d love it if you did that.

If your entry is interactive or moving, you will have to publish it on a separate site (your own site is preferable but social sites like YouTube are perfectly acceptable). Just remember to send us the link.

The competition closes at 11pm GMT on Monday 20th June 2011.

Winners will be announced by Monday 4th July 2011.

The Datasets

You can find the data collected by David McCandless here.

You may also find the following resources useful:

Guardian DataBlog post on Oxbridge Elitism

UCAS Annual Datasets

And Remember, the Competition Closes at 11pm GMT on Monday 20th June 2011.


Wednesday
Jun012011

Artfully visualizing our humanity: Aaron Koblin's TEDTalk 

In March 2011, Aaron Koblin, Creative Director of Google’s Data Arts team, gave a good TEDTalk presentation, Artfully Visualizing our Humanity, looking at a number of his visualization projects, and how visualizing data is becoming our interface to large datasets.

Artist Aaron Koblin takes vast amounts of data — and at times vast numbers of people — and weaves them into stunning visualizations. From elegant lines tracing airline flights to landscapes of cell phone data, from a Johnny Cash video assembled from crowd-sourced drawings to the “Wilderness Downtown” video that customizes for the user, his works brilliantly explore how modern technology can make us more human.

Found on FlowingData.com and Infosthetics.com

The video is now also available on YouTube:

Monday
May302011

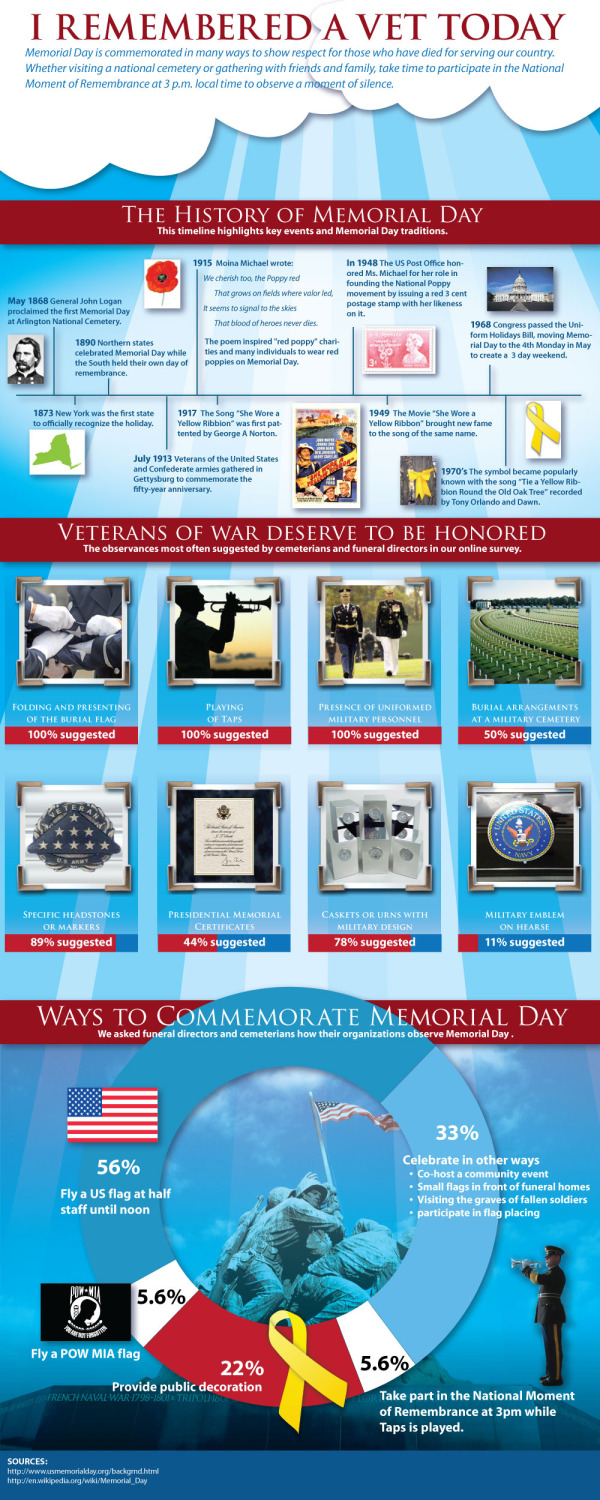
The History of Memorial Day #infographic


Appropriate and timely for the holiday today in the U.S., imortuary.com brings us I Remembered A Vet Today infographic about the history and ways to commemorate Memorial Day.

Memorial Day is commemorated in many ways to show respect for those who have died for serving our country.  Whether visiting a national cemetary or gathering with friends and family, take time to participate in the National Moment of Remembrance at 3 p.m. local time to observe a moment of silence.

Designed by the team at KillerInfographics.com.  Thanks to Charlie for sending in the link!

Thanks to all of our troops!

Friday
May272011

The Information Blanket

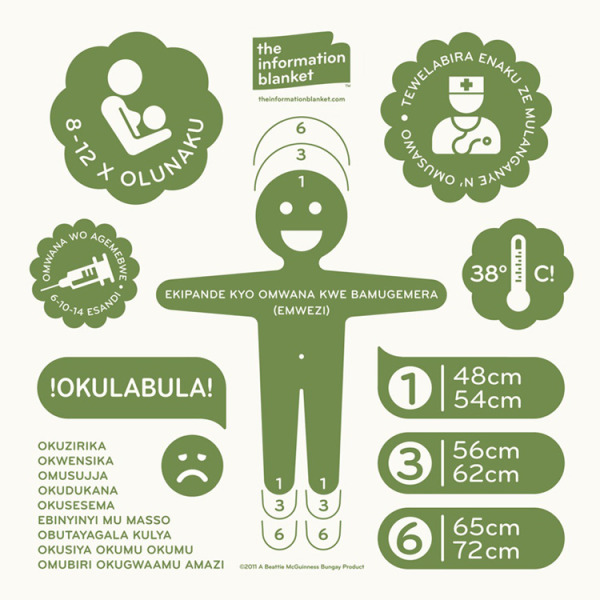
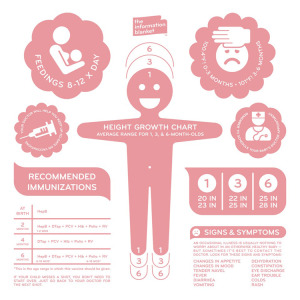
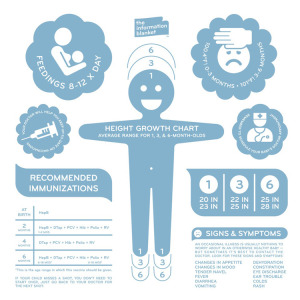
The Information Blanket is a very cool project conceived and produced by Beattie McGuinness Bungay New York.  Intended as a charity blanket to be donated to kids in under-developed countries, the blanket is printed with information to help the mothers learn about their baby’s health.  The blankets include information about breastfeeding, immunization vaccinations, body temperature and warning signs of illness, all printed in the local language.

There are two ways to participate.  You can buy one for yourself, and one will be donated automatically ($60) or you can just donate one to a child Uganda ($25).  The ones you buy for your self are in English (pink or blue), and the ones that will be distributed in Uganda are in Lugandan (green).


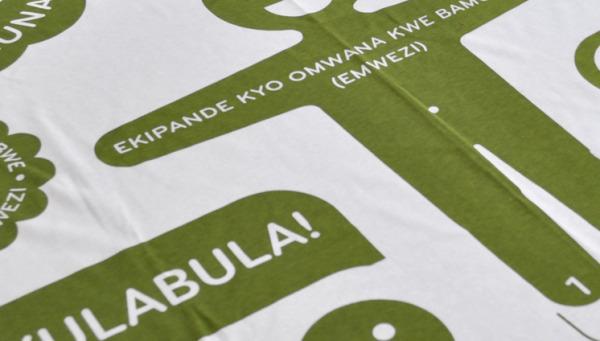
the story of our blanket is one of care and responsible craftsmanship. it begins with green-sensitive 100% double knit north carolina cotton. soft and durable, it meets the strictest u.s. environmental standards on dyes and finishing. when it’s ready, the fabric is pre-shrunk and shipped to new york city where local craftsmen cut it to swaddling size and double lock stitch the edges. the informational graphics are then screen-printed using non-toxic water based inks. the result is a blanket of the highest individual quality.

Our design includes a growth chart with average ranges for one, three and six months, breastfeeding and vaccination frequency, high temperature alert, doctors appointment reminder and a list of illness warning signs.


Found on Twitter via @katerryna and Creativity-Online.com