About
Randy Krum
President of InfoNewt.
Data Visualization and Infographic Design

Infographic Design

Infographics Design | Presentations
Consulting | Data Visualizations

DFW DataViz Meetup

Join the DFW Data Visualization and Infographics Meetup Group if you're in the Dallas/Fort Worth area!

Search the Cool Infographics site

Custom Search

Subscriptions:


Feedburner

The Cool Infographics® Gallery:

How to add the
Cool Infographics button to your:

Cool Infographics iOS icon

- iPhone
- iPad
- iPod Touch


Read on Flipboard for iPad and iPhone

Featured in the Tech & Science category

Flipboard icon

Twitter Feed
From the Bookstore

Caffeine Poster

The Caffeine Poster infographic

Entries in history (262)

Wednesday
Dec182013

The 100 Most Influential Cameras in History

The 100 Most Influential Cameras in History infographic poster

Another great infographic poster from the team at Pop Chart Lab!  A Visual Compendium of Cameras lines up the 100 most influential cameras in history in Chronological order.

A meticulously illustrated catalog of 100 landmark cameras, culled from over a century of photographic history, depicting both professional and consumer models and tracing photography’s history from the first models to today’s digital wonders.

Available unframed for $28 from the Pop Chart Lab Store.

Found on Fast Company Design!


You can see this one and many other infographic posters collected on the Cool Infographic Posters page or my Infographic Posters board on Pinterest!

Monday
Dec162013

The Genealogy of Baseball Teams

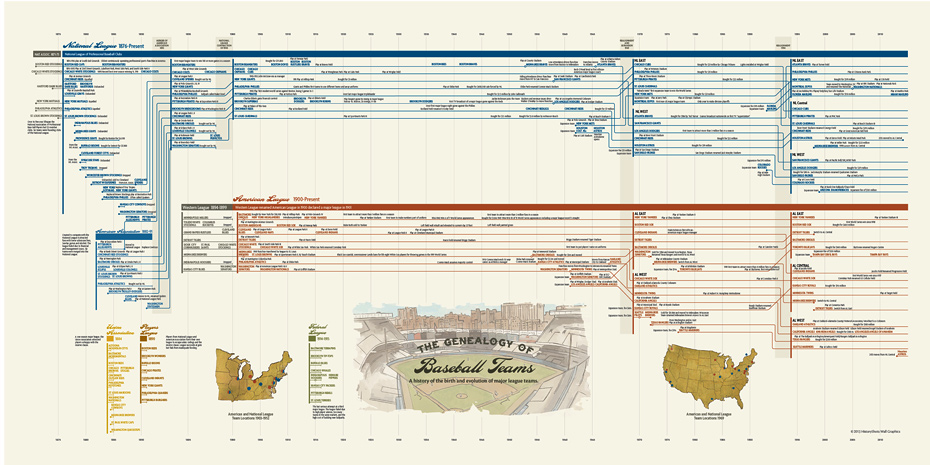
The Genealogy of Baseball Teams infographic poster

New infographic poster released by HistoryShots, The Genealogy of Baseball Teams charts the lineage and evolution of the major league teams.  Covering more than 140 years starting in 1871!

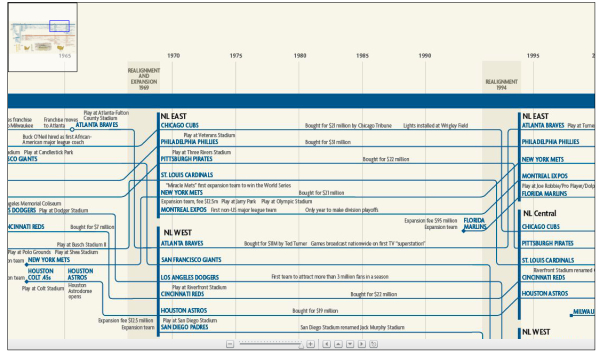
The Genealogy of Baseball Teams chronicles the origin and evolution of baseball teams from every major league from the inception of the National League in 1876 to the present day. Trace the fascinating histories of the Boston Red Caps to the Altanta Braves from the Washington Senators to the Minnesota Twins from the Brooklyn Trolley Dodgers to the Los Angeles Dodgers.

The Genealogy of Baseball Teams infographic poster closeup

Printed poster available for purchase from HistoryShots is 42” x 20”, and starts at $36.


You can see this one and many other infographic posters collected on the Cool Infographic Posters page or my Infographic Posters board on Pinterest!

Friday
Dec132013

100 Years of Rock Visualized

100 Years of Rock Visualized infographic

From Gospel to Grunge: 100 Years Of Rock in Less Than a Minute is an ambitious design project from ConcertHotels.com.  It’s an animated, interactive timeline design that let’s you click on any genre to highlight it’s specific history and play a sample of the appropriate music.

The history of rock music is pretty interesting. Everyone knows that it’s roots lie in genres like Gospel, but what about all the other genres?

How did Cowpunk come about? Or Indie Rock? Or Nu Metal?

These are the sorts of questions we ask ourselves here at Concert Hotels (oh, and other important topics like what we should have for lunch).

Curiosity piqued, we decided to trace the roots of the various rock genres, kinda like ‘Who do you think you are?’ but for rock music, and then visualize it.

We embarked upon what turned into a mammoth research task, the likes of which none of us have undertaken since college. But we stuck with it. We think it was worth the effort.

Ladies and gentlemen, we give you our Rock Time Machine - click here to journey through 100 years of rock in less than a minute.

And there’s more - while we were at it we thought it might be pretty cool to be able to hear a sample of each genre.

So turn your speakers up to 11 (or pop your headphones in if you’re the considerate type) - you never know, you might just find a new music genre to fall in love with.

Although music heritage isn’t an exact science, the color-coded flow arrows are easy to follow throughout the design.  However, they get more complicated at the bottom.  Apparently there hasn’t been any new music since Y2K?

Found on Fast Company


Friday
Nov152013

Two Years Without Steve Jobs: Has Apple Crumbled?

Two Years Without Steve Jobs: Has Apple Crumbled? infographic

Has Apple Crumbled? is an infographic from WhoIsHostingThis.com that takes a close look at the business and financial results of the last couple of years under Tim Cook’s leadership.

With the passing of Steve Jobs in 2011, many tech industry experts were quick to predict that his company, Apple, Inc., would soon falter without its charismatic founder at the helm. Yet in the years since Jobs’ successor, Tim Cook, has taken the wheel, Apple has not only continued on, but flourished.

The design starts off well, but gets lazy towards the bottom with a number of statistics shown in text only, and not visualized.  Readers will perceive these values as less important and visually skim right over them.  With a mix of visualized data and text only data, the text only values are perceived as secondary information and often ignored.

I really like the character illustrations. They are minimal, but still easily recognizable.  The same goes for the product icons.  Minimal but easily recognizable.

The footer does a good job with sources and the company logo, but should have also included the URL link back to the original infographic landing page so readers can find the full-size original version.

Found on MacTrast.com

Tuesday
Nov122013

Star Wars Episodes IV-VI Character Poster

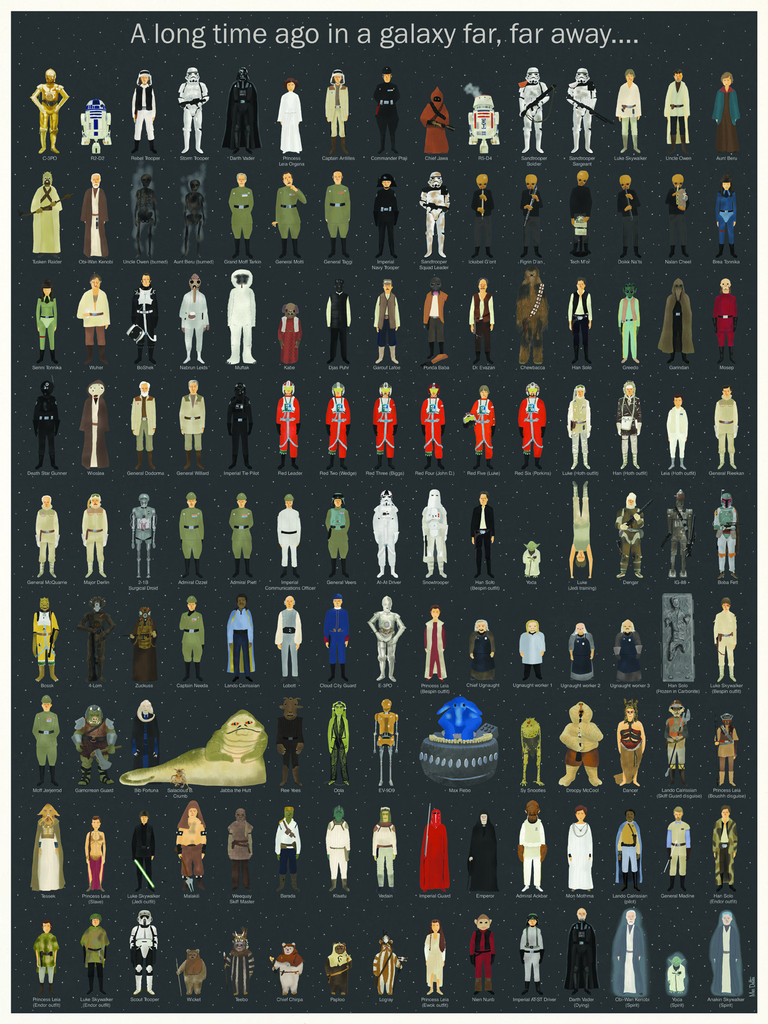
Star Wars Episodes IV-VI Character Poster

The Star Wars Episodes IV-VI Character Poster from designer Wes Anderson is a fantastic visual tribute to the Star Wars series.  The limited run of 500 printed posters sold out in a few days on Spoke Art, but everyone can still admire the design online.

In 1978 my father took me as an excuse to go see that movie about silly robots and spaceships that everybody was talking about. I didn’t get much at that time, since I was very young, but what I do remember well is how much I enjoyed beginning my first geeky action figures collection that came right after the movie. My first figure ever was Luke Skywalker, a figure that got lost over the years. I’m still looking for it on my parent’s attic. Where are you Luke Skywalker?

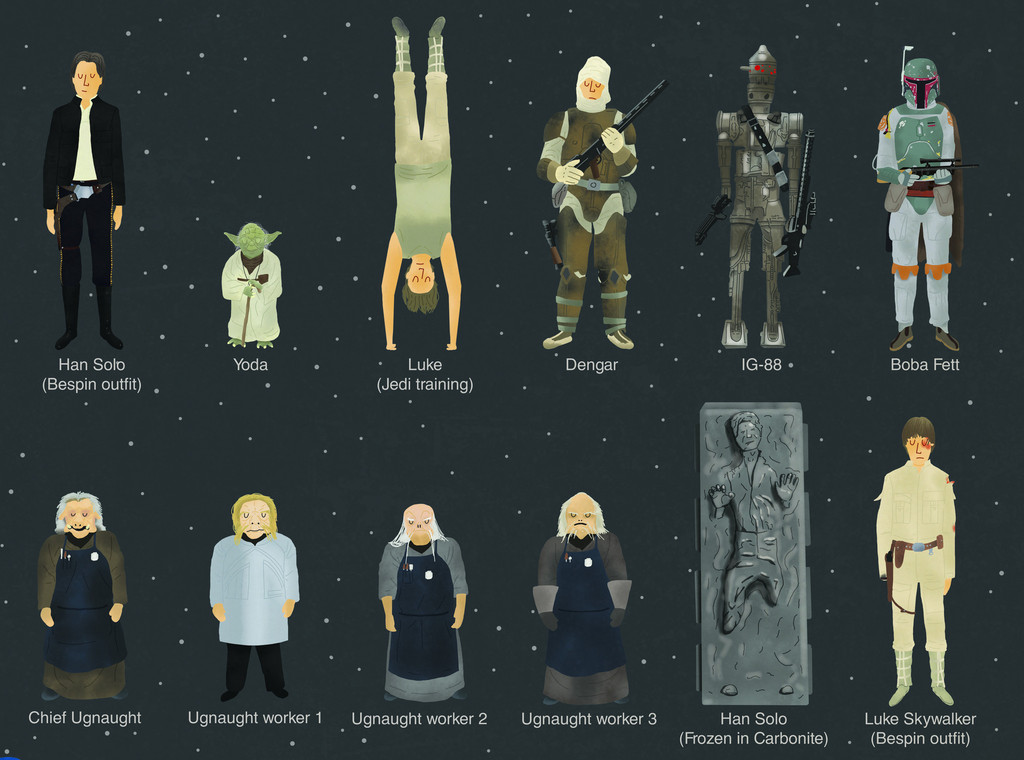
With the time I became a fan, of course. As homage to that great moment of my life, here’s a new poster featuring (almost) every character of the first Star Wars trilogy in order of appearance. It is of course limited and numbered. If you want a copy, this link will take you to Spoke Art Gallery’s online shop where you can easily order one and receive it at your front door. We gave the mailmen specific orders to be dressed as Storm troopers during delivery, but they didn’t take it so well, so they probably won’t.

Star Wars Episodes IV-VI Character Poster detail


Found on Nerd Approved, Technabob, and the Fire Wire blog

Friday
Nov082013

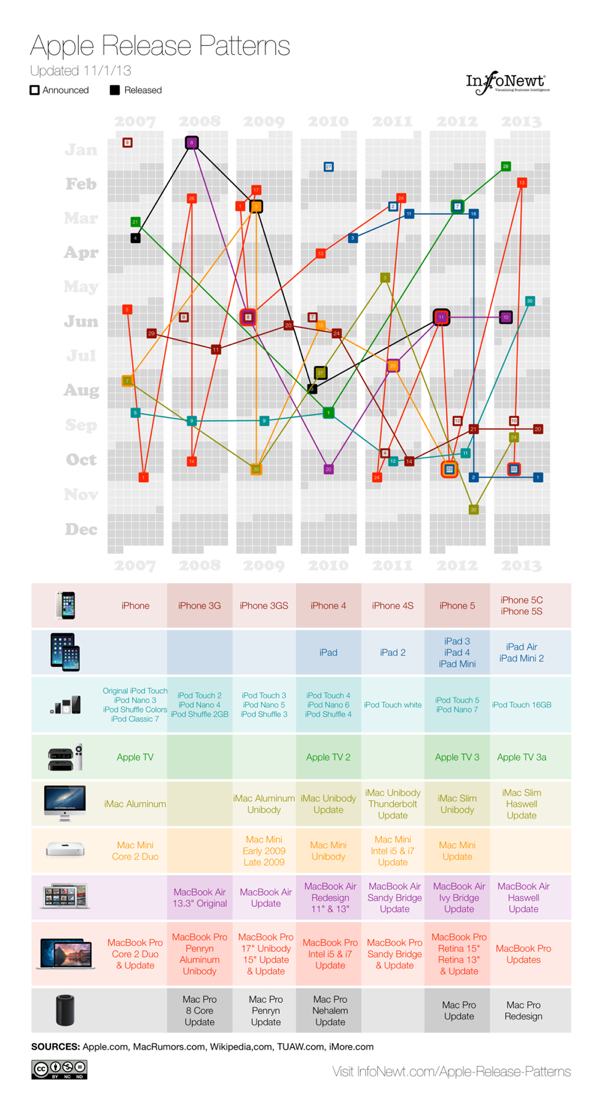
Apple Release Patterns

Apple Total Release Patterns infographic

Apple Release Patterns is a new personal project of mine, and you can find the full-size original versions on a new, dedicated landing page on the InfoNewt.com site.  Every few months Apple releases a new product update or redesign, and the rumors start flying about what the upcoming product will be during the preceding weeks.  For better or worse, those speculations are often based on what was released in the same timeframe the prior year.

This data visualization lines up vertical columns for each year, starting with 2007.  I decided that anything further back wasn’t really relevant to Apple’s current practices.  Each product release is then mapped onto the calendar, showing a pattern (or lack of pattern) to the product releases.  If the product announcement was separate from the actual release date, I mapped that date as well.

This data was ripe for a visualization.  When I tried to look at the historical dates of product releases, the information was scattered across multiple sites, confusing and difficult to gather.  Some information was contradictory, which required further investigation.  So, the data topic itself was a good target for a clear, easy-to-understand visualization.  However, the design with all of the products was too complicated visually to perceive any defining patterns.  So, I created separate versions that break out the products into 3 categories, and those are much easier for readers to see the patterns.
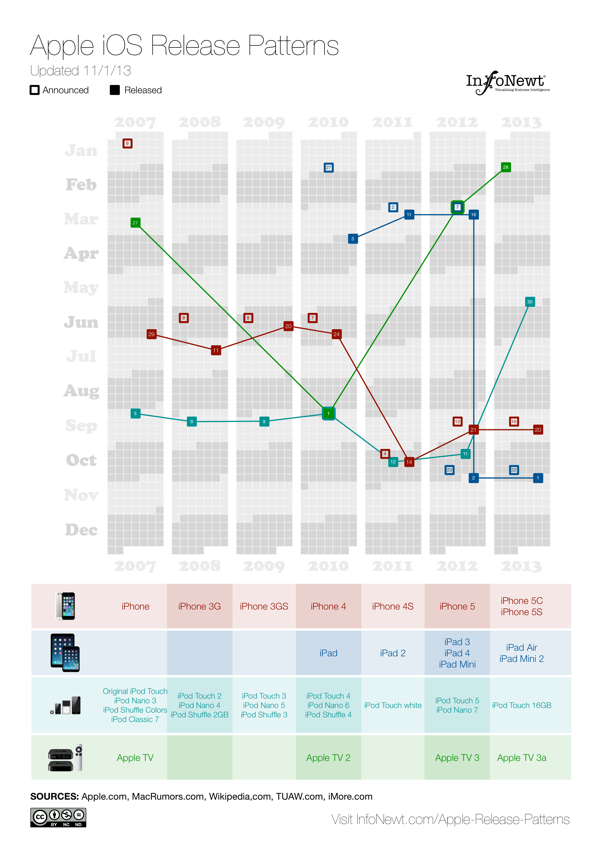
Apple iOS Release Patterns infographic

For iOS devices (iPod, iPad, iPhone and AppleTV) you can see the pattern shift in 2011 for most of the products to a Fall timeframe.  You can also see a recently consistent announcement date with the product release the following Friday.
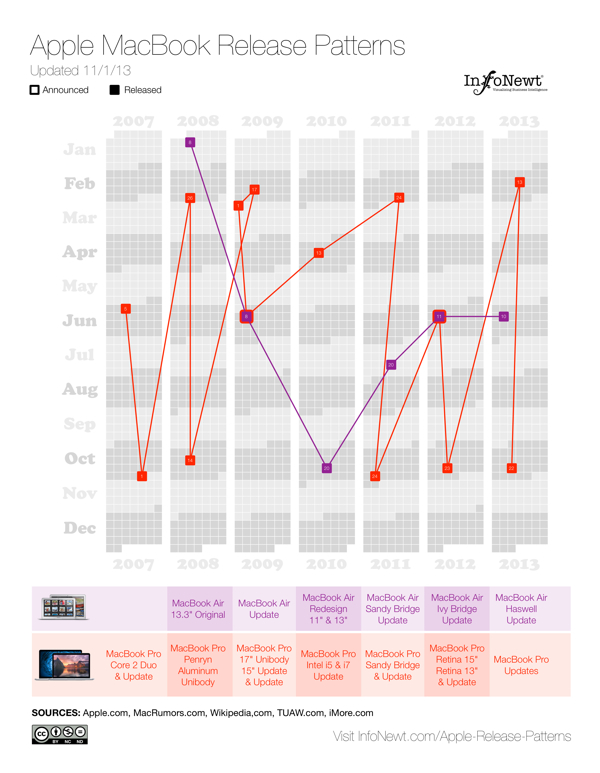
Apple MacBook Release Patterns infographic

For Apple’s laptop line, the MacBooks, you can see the MacBook Air has become a regular release during the Worldwide Developers Conference (WWDC) in June, and the MacBook Pro gets fairly regular updates twice a year, usually just to update the internal specifications.
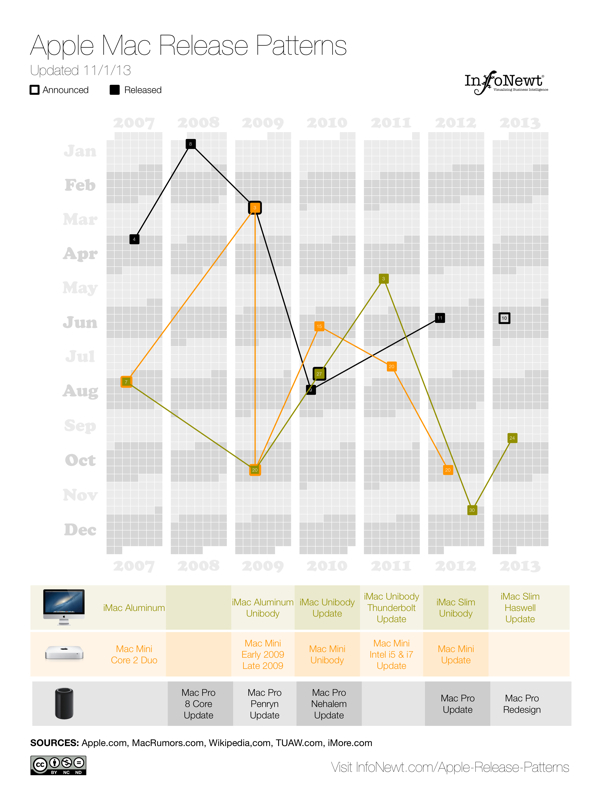
Apple Desktop Mac Release Patterns infographic

The desktop Mac line doesn’t seem to show much pattern at all.  They might get an update each year, but the timing is erratic.  Sometimes they are part of WWDC, sometimes part of the Fall iOS events, and sometimes completely on their own.

I’m going to keep updating these on the landing page as Apple releases new products in the future (upcoming iPad Mini 2 Retina and Mac Pro still need to start shipping this year).  I want these to become a valuable resource every time the Apple rumor mill heats up about the next product announcement.  If you use the embed code on the Apple Release Patterns landing page, your site will also display the updates automatically as they become available.

This is version 1.0.  I have some ideas and improvements I want to make in future versions, but I would love to hear your thoughts as well.  Post any suggestions or feedback in the comments below.

Monday
Oct212013

Cars of the Silver Screen

Cars of the Silver Screen infographic

Cars of the Silver Screen infographic by moneysupermarket.com.

Looking for car insurance can be a time consuming and expensive business. However, if you were trying to insure some of these film treasures you might expect a few extra zeros on the end of your premium! From the Ford Mercury that James Dean famously drove in his last film, Rebel Without a Cause, to the brand new Audi R8 e-tron that Tony Stark drives in Iron Man 3, cars have played a massive part in iconic film history.

However, it is not always the ultra-cool cars that steal the limelight in blockbuster movies. Quite often the most memorable cars are the most unlikely. Take, for instance the Cadillac ‘Ecto-1’ that the Ghostbusters used to get around the busy New York streets, or the Volkswagen Beetle that got into so many scrapes in the Herbie movies.

To celebrate these unlikely heroes, we’ve taken a look at the timeline of great cars of the silver screen.

Interesting topic choice for Money Super Market.  For successful infographics, choosing a relevant topic with related keywords and search criteria can make a big difference.  Good link bait brings views and links from readers that are interested in the topic, and ideally even raises awareness with potential customers.

I’d like to hear your opinion.  Is this infographic about cars from movies relevant to a site that helps people find car insurance?  Leave your thoughts in the comments.

Thanks Paul for sending in the link!

Monday
Sep302013

10 Things You Probably Didn't Know About the iPhone

10 Things You Probably Didn't Know About the iPhone infographic

10 Things You Probably Didn’t Know About the iPhone from NextWorth takes a look at some of the amazing stats and facts about Apple’s flagship product.

Designed by InfoNewt, this infographic is a good case study in topic selection and release timing.  September was a month full of Apple iPhone news and hysteria surrounding the release of the new iPhone 5S, the iPhone 5C and the major upgrade to iOS 7.  There were a bunch of infographics released about the rumors surrounding the new phones, but as soon as the new iPhones were officially announced all of the rumor designs became obsolete.

The topic choice and data visualized in this design has a much longer online lifespan.  The content about the history and growth of the iPhone will be relevant for at least a year, maybe longer.  The infographic will continue to drive traffic and links to the NextWorth site.

Monday
Sep302013

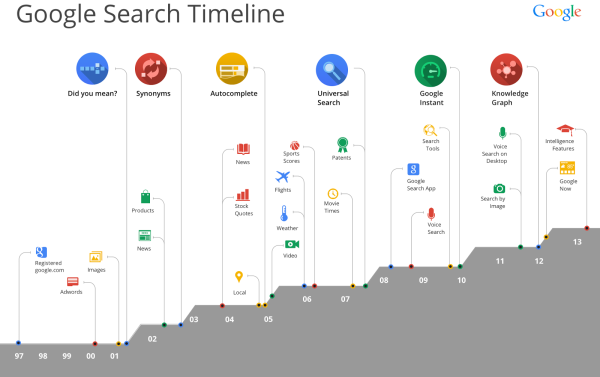
15 Years of Google Search

15 Years of Google Search timeline infographic

Last week, Google celebrated its 15th year, and posted the Google Search Timeline to help remember how far we have come in that time.

Google Search is turning 15. Remember what it was like to search in 1998? You’d sit down and boot up your bulky computer, dial up on your squawky modem, type in some keywords, and get 10 blue links to websites that had those words. It seemed like magic (and it was way way faster than card catalogs and microfiche!).

The world has changed so much since then: billions of people have come online, the web has grown exponentially, and now you can ask any question on the powerful little device in your pocket. You can explore the world with the Knowledge Graph, ask questions aloud with voice search, and get info before you even need to ask with Google Now.

I love the visual design, with icons and minimal text in the design to show all of the major milestones.  

I don’t understand the increasing area chart across the bottom though.  It isn’t representing any data, and each step up coincides with one of the major advancements across the top.  It’s visual, but it doesn’t have any meaning.  You would think it could show the growing total number of searches or stock price or amount of data processed.

Found on TechCrunch


Wednesday
Sep042013

The Guide to Star Trek Uniforms

The Guide to Star Trek Uniforms infographic

The Gude to Star Trek Uniforms infographic from Costume Supercenter. Make sure you know what uniform your wearing!

When the original Star Trek television series started, male and female officers wore similar outfits. The male Star Trek uniforms consisted of black pants, black boots and a velour shirt with the symbol on the left side. Females wore the same type of shirt, with black boots and tights, and a black skirt, although in some cases they wore black pants. The color of shirt worn identified the branch the crew member belonged to. Those in green shirts worked for command personnel, while beige stood for operations, and blue was for medical personnel only. The velour shirts were changed to nylon shirts starting in the third season. You can find many of the Star Trek Costumes here.

Don’t be the red-shirted ensign!

The footer of the design should include the copyright information and the URL to the original infographic landing page so readers can see the full-size infographic.  The Costume Supercenter logo should also be somewhere on the design to connect the infographic to the publishing company.

Found on Visual.ly