About
Randy Krum
President of InfoNewt.
Data Visualization and Infographic Design

Infographic Design

Infographics Design | Presentations
Consulting | Data Visualizations

DFW DataViz Meetup

Join the DFW Data Visualization and Infographics Meetup Group if you're in the Dallas/Fort Worth area!

Search the Cool Infographics site

Custom Search

Subscriptions:


Feedburner

The Cool Infographics® Gallery:

How to add the
Cool Infographics button to your:

Cool Infographics iOS icon

- iPhone
- iPad
- iPod Touch


Read on Flipboard for iPad and iPhone

Featured in the Tech & Science category

Flipboard icon

Twitter Feed
From the Bookstore

Caffeine Poster

The Caffeine Poster infographic

Entries in history (262)

Tuesday
Aug202013

The History of Music Media - From Vinyl To Bitstreams

The History of Music Media infographic

A creative timeline view of The History of: Music Media infographic from Indigo Boom. The colors track the popularity of each new and old source of music media through the years. From left to right it goes 0% popular to 100% popular. 

Selling music as recordings first became possible in 1877 with the introduction of the phonograph cylinder. Since then media formats have developed and radically changed the way we listen, and recently even where we can listen to music. We have looked at the last 30 years of music format development and popularity in the infographic below.

Beautiful, colorful design. This is a vertical stacked area chart covering the last 30+ years of music sales. You can see that in 1980 (where the chart begins) vinyl was already in decline. CDs have had a big run, but downloads are obviously growing to become the new dominant method to get music.

I like that the design tells one story really well, and doesn’t get into a whole bunch of extra data points. It’s a simple, clear story to the readers who can understand the content quickly and then move on.  

The source listing of The RIAA is too vague.  Source listings should include a link to the specific data so others can examine the original dataset if they wish.  I went to the RIAA site, and it appears that they are selling this information in a report. Publishing the data publicly in an infographic may be a violation of the terms of service or copyright of the report, but I can’t tell because I can’t determine where the specific data originated.

The URL to the infographic landing page should be included in the footer of the design so readers can find the original when they come across a smaller version posted on another site.  Not all sites are good about linking back to the original.

Thanks to Bogdan for sending in the link!

Monday
Jul292013

Apple's Infographic Timeline Poster

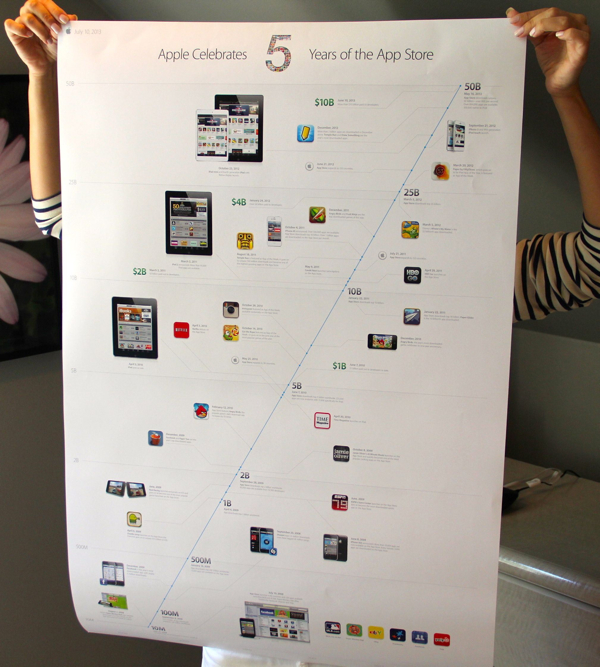
Apple Celebrates 5 years of the App Store infographic timeline poster

Apple just released the infographic timeline poster, Apple Celebrates 5 Years of the App Store.  Copies of this poster were sent to various members of the press.  The above photo is from Lauren Goode from All Things D.

If anyone has a copy they don’t want, I would love to get a copy!

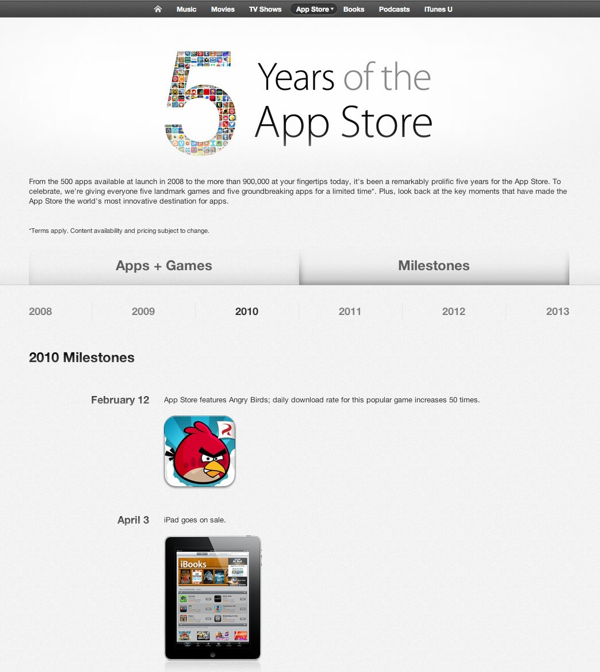
Sadly, no high-resolution versions of the poster are available online, but the data is available to view from within the iTunes Store.  You can see the images, icons and events, but they aren’t laid out like the poster timeline.  You can view the events in iTunes by following this link.

Found on All Things D 

Tuesday
Jul092013

What Is Autism?

What Is Autism? from Global Medical Education is a long, informational infographic that covers the symptons, signs, types, treatments and history of diagnosing autism.

Autism Spectrum Disorder is very common. About 1 in 50 school aged children had parent reported ASD in 2011-2012. There have been changes in DSM-5 with the category of Autism Spectrum Disorder being introduced  which includes Autistic disorder, Asperger’s disorder, Rett’s disorder and Pervasive Developmental Disorder-NOS from DSM-IV. Researchers have studied several important questions in this disorder.

This is a big design with a bunch of good information.  However, I think it’s way too much text for an infographic.  Infographics should make information easier to understand, and most readers won’t stick around to read this much information.  In fact, many readers won’t read any of the information because that much text is intimidating and implies an investment of time and attention by the reader.

The information is fantastic, and should have been broken up into multiple infographics to cover the different topics.  This would make the information easier to digest, and would also spread out links and views to the hosting site over a longer period of time.

Thanks to David for sending in the link!


Friday
Jun282013

Ba-tee-nga: Sheldon Cooper Presents Fun With Tees

Bah-tee-nga: Sheldon Cooper Presents Fun With Tees infographic

Ba-tee-nga: Sheldon Cooper Presents Fun With Tees infographic from RIPT Apparel shows every t-shirt that Sheldon Cooper from Big Bang Theory wore each episode of every season.

We have all seen The Big Bang Theory, and its awesome cast of nerds. But did you ever wonder about Sheldon’s graphic tees and how many different ones there actually were? This weeks infographic takes a look at the many shirts of Sheldon Cooper titled “Ba-TEE-nga: Sheldon Cooper Presents Fun With Tees”. Much like RIPT Apparel’s graphic tees, this is a mash-up of the famous saying Sheldon made popular; “Bazinga”, coupled with his awesome web show – “Sheldon Cooper Presents Fun With Flags”. The graphic shows all of Sheldon’s shirts from the pilot episode through season 6 episode 7. Yeh that’s a ton of Tees!

An ideal topic for an infographic!  Can you imagine how boring this would have been as a text list in a blog post?!? 

Thanks to Bill for submitting the link via Twitter!  Bazinga!

Thursday
Jun132013

Visualizing International Criminal Tribunals


Visualizing International Criminal Tribunals

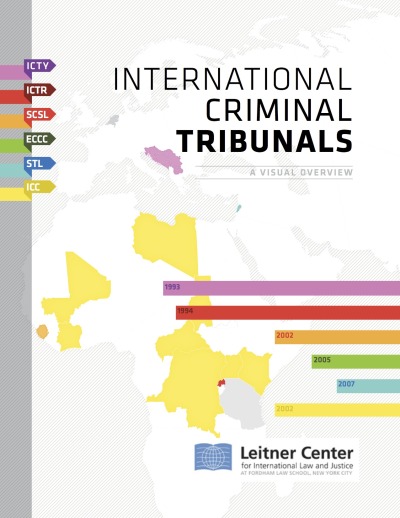
Very cool report that uses data visualization and infographics design to communicate complex information about International Criminal Tribunals from the Leitner Center for International Law and Justice at Fordham Law School, New York City.

The Leitner Center launches a new report, “International Criminal Tribunals: A Visual Overview,” providing an introduction to the work of the international tribunals and the conflicts which led to their establishment. Despite widespread interest in these tribunals and the view that they represent a definitive advance of international law and justice, there is also much confusion and misconception about their work. This new 90-page report, providing analysis and information through written summaries and detailed visualizations, aims to make the work of the courts more accessible to the general public and legal professionals alike.

Media attention dedicated to the work of the tribunals is too often superficial, and tends to confuse key distinctions between them; more informed scholarship, on the other hand, is largely confined to specialty publications, remaining inaccessible to most. “International Criminal Tribunals: A Visual Overview,” aims to provide well-researched and accessible information for anyone wishing to more fully understand these issues. This will help democratize engagement with these courts, which are tasked with delivering justice for victims of some of the world’s worst atrocities. Examples of the visual graphics in the report are included below.
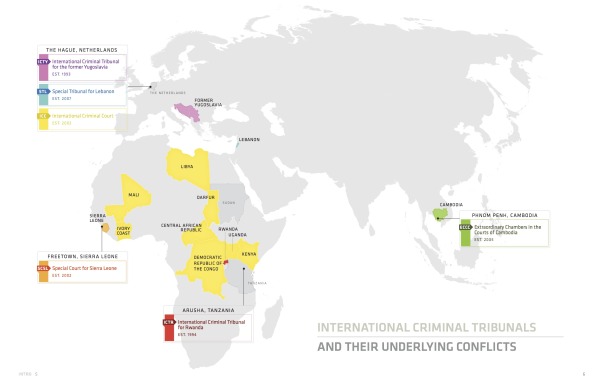
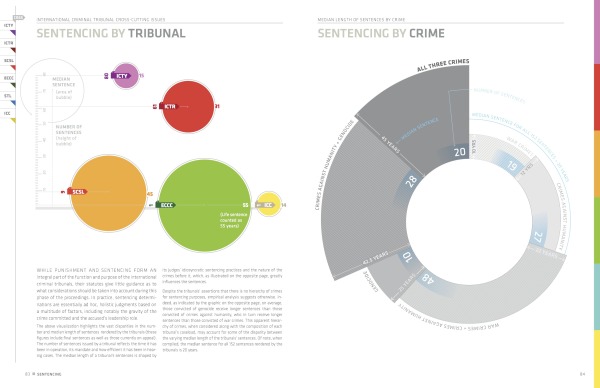
 

Awesome use of different styles of data visualization to summarize the often-complex information behind these tribunals.  Timelines, maps, area charts, polar grids, rose diagrams and treemaps.  The Case-by-Case timeline are fascinating.

The complete report is publicly available as a PDF for download.

I asked Daniel McLaughlin a few questions about the development and design of the report:

Cool Infographics: What software, websites or tools did you use to create the visualizations?

Daniel: We used Adobe Illustrator and InDesign to create the visuals for the report.

Cool Infographics: Did you create the report yourself, or use a design team?

Daniel: As a lawyer working with law students on this project, I was dependent on graphic and information design volunteers to create the visuals. The students and I carried out all the substantive research and then worked with these volunteers to figure out how best to translate it visually. Paula Airth of www.bepeculiar.com, in particular, was instrumental in bringing the project to life.

Cool Infographics: How long did the report take to design and put together?

Daniel: The report started out as a short (8-9 page) publication on the work of the international criminal tribunals. It grew into the present 90 page version as we continued to accumulate new data and the graphic/information design volunteers continued to create new graphics. All told, the research took around 4 months and the creation of the visuals/layout took another 5 months or so.

Cool Infographics: How has the use of data visualization design and social media impacted your marketing?

Daniel: The goal of this publication was to make the work of the international criminal tribunals more accessible to lawyers and non-lawyers alike. As indicated in the publication,

“There is wide awareness, though little true understanding, of the work of the international criminal tribunals.  International prosecutions of high-ranking civilian and military leaders, including former heads of state, on charges of crimes against humanity, war crimes and genocide, represent for many the ultimate condemnation of these individuals’ past actions and a measure of their fall from power. Yet, despite the tribunals’ grasp on the popular imagination, they are the subject of significant misconceptions and confusion. Much of the media coverage dedicated to their work remains superficial, at best, and largely muddles over key distinctions between various tribunals, past and present. Conversely, the more informed scholarship is largely confined to specialty publications that remain inaccessible to most. In truth, many lawyers and non-lawyers alike lack a clear understanding of the role and functioning of these increasingly-pivotal international institutions.  This publication seeks to redress this knowledge gap by providing well-researched and accessible information for those wishing to more fully understand the international criminal tribunals and the conflicts over which they have jurisdiction. An informed public is an engaged public - and the issues that animate these tribunals, including delivering justice for victims of some of the world’s worst atrocities, are too significant to be discussed solely by a small cadre of international criminal law specialists.

Notably, this publication was created in partnership with graphic and information designers so as to reach a broader public. The designers’ visualizations present information regarding the tribunals and their underlying conflicts in a direct and accessible manner to a wide range of viewers, including those without a legal background. Beyond this democratizing function, information visualization also serves to reveal important data and trends that might otherwise go unnoticed in a more conventional format. Ideally, the following information, which is current as of January 2013, would be integrated into a continually updated interactive webportal dedicated to engaging a global public on issues of international justice.

In sum, this publication aims to facilitate a broader discussion of the international criminal tribunals’ notable accomplishments, as well as ongoing shortcomings.”


Thanks to Daniel McLaughlin for sending in the link!

Monday
Jun032013

The History of NFL Logo Designs

The History of NFL Logo Designs infographic

Football is extremely popular in the United States. People pick sides and cheer on their teams loyaly.  The History of NFL Logo Designs infographic posted on Visual.ly tells the story of each football team’s logo through the years.

In Infographics below we are going to show you some of the interesting logo design changes across the (NFL) community with their territory maps.

Cool design that shows visual evolution of various NFL logos.

Thanks to Rachael for sending in the link!

Thursday
May162013

The Stephen King Universe

The Stephen King Universe infographic poster

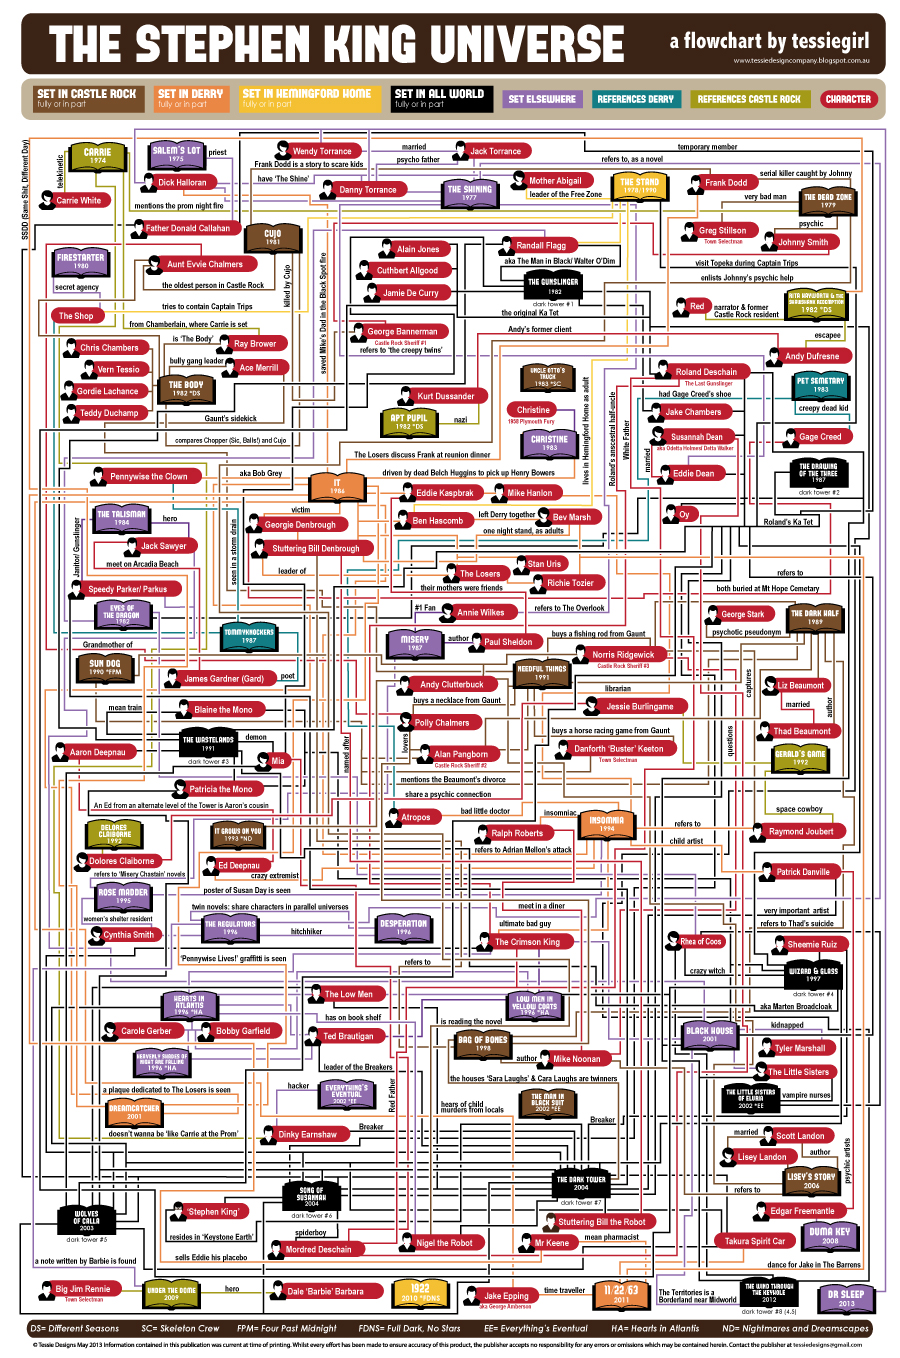
Are you a Stephen King fan? Have you yourself made these connections? From TessieGirlThe Stephen King Universe has been updated to include the many connections to the Dark Tower series.

When I was in Grade 5 (guess I was ten), my friend Tarnya Smyth brought her mum’s battered copy of Stephen King’s ‘Carrie’ to school. We broke it into about 4 pieces and passed them around, all taking turns reading each battered section. I told mum about it and she FLIPPED HER WIG and told me to ‘Stop reading that book immediately!!’ So I finished it.

Now, I TOTALLY do not recommend  ten year olds reading Stephen King books (messed me up good), but this was when my life long relationship with Mr King began. My love for his books is based around his characters. They are so full. I love Stephen King dialogue. I love his sense of humour. And I love the links and connections between the books. I am the kind of annoying person who likes to know the ‘In Joke’. So, of course, I MADE A FLOW CHART!!!

This chart is like my fourth child. Be kind to it. It means a lot to me.

I wish they had published a higher-resolution version online.  Some of the text is too small to read, but I think I can follow all of the connections.  A must have for any Stephen King fan!

Also, it’s available for purchase as a poster from the TessieGirl site for $25 plus shipping from Australia.  You can also see the original version.

Thanks to Becky for sending in the link!

Friday
May032013

The Foursquare Visualizer

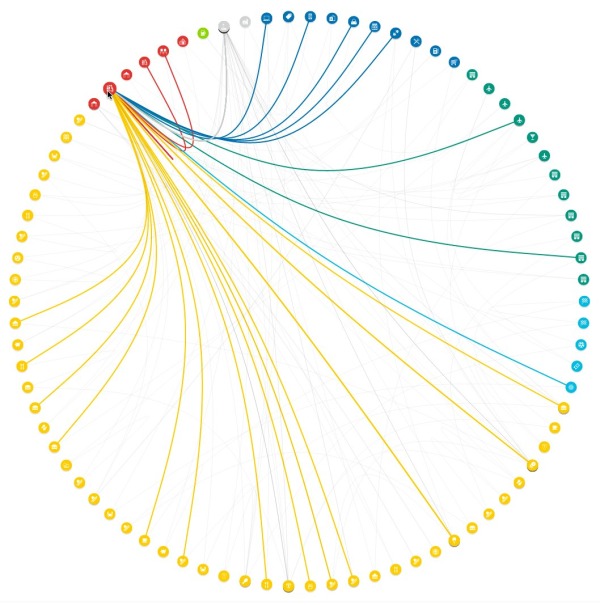
The Foursquare Visualizer interactive infographic

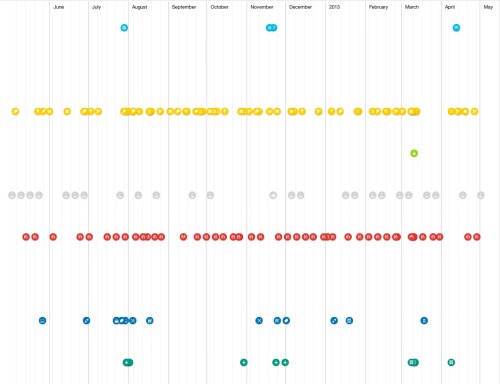
Foursquare has release a new Foursquare Visualizer, that creates an interactive data visualization of your own activity for the last 12 months.  I included the images from my own history.

At Foursquare, we’ve always known how very special our community is. Today, April 16 (4/4^2), marks the fourth annual 4sqDay. Each year, we take this opportunity to thank our amazing community for all that they do.

…take a peek back into your own history at foursquare.com/visualizeme. It’s just our small way of saying, “Thanks! We think you’re awesome.”

There are a handful of different visualizations of your own history of check-ins available.  The connection circle (shown above) is the best looking.  Other visuals include a Timeline and Categories.

Found on the Foursquare blog


Thursday
May022013

The United States of Energy

The United States of Energy infographic poster

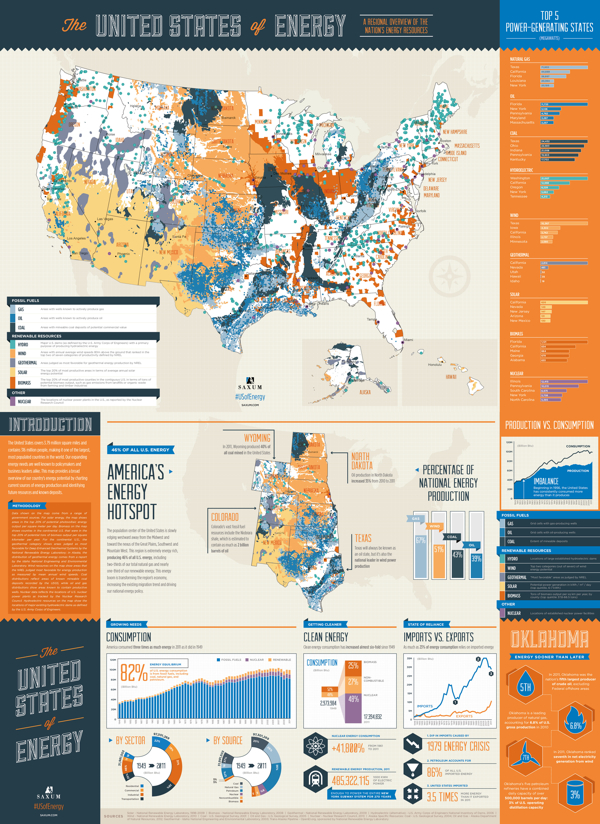
The United States of Energy from Saxum, is a huge project to map domestic energy sources.  

Finally… After almost 50 years of dependence on foreign sources to meet our growing energy needs, our country is finally in a position to begin reversing the trend. Through advances in drilling technology, discoveries of new oil and natural gas reserves and swift progress in the renewables sector, the United States is setting a course for energy self-sufficiency.

What began as a simple graphic showcasing America’s energy riches quickly grew into a two-sided, folded map concept displaying thousands of individual data points.

The #USofEnergy map visualizes our country’s energy potential by charting current sources of energy production and identifying future resources and known deposits. Energy resources surveyed include: natural gas, oil, coal, nuclear, hydroelectric, wind, geothermal, solar and biomass.

This is actually designed as two landscape posters as the front and back, but when put together, they make one very detailed portrait orientation poster.  I love the main U.S. map that is the primary focus, and the designers took on the challenge to visualize the many different energy sources as represented with the overlapping colors.  You’ll notice that the smaller area coverage shapes are always on top, so the small circles aren’t completely hidden by the larger area shapes.  I would have attempted making the colored areas slightly transparent to let the underlying shapes show through, and removing the text names of all the states might have helped to reduce the visual noise.

My power contract for InfoNewt here in Texas is 100% Wind Power, but I had no idea that Texas is the national leader in wind power production!

I’m not sure what to call them, but I like the paired 180° doughnut charts showing how the sectors and sources of energy have changed from 1949-2011.  However, I don’t like the chart legends that makes them hard for the reader to figure out what each color represents.  Legends are evil!  It would have been nice for the nine types of energy to be shown with icons (along with the color-coding), and the icons or text could have been shown along with the larger 2011 doughnut segments.

The statistics shown at the bottom are shown as just text numbers.  In contrast to all of the data visualizations throughout the rest of the design, this makes these numbers seem unimportant to the reader.

Found on Visual.ly

Friday
Apr262013

2,000 Years of Continental Climate Changes

2,000 Years of Continental Climate Changes

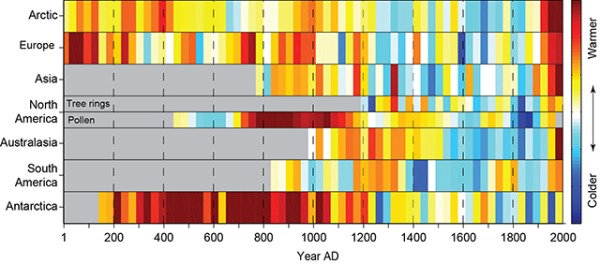
Climate change is a complicated, and sometimes controversial, global topic.  I really like this data visualization of 2,000 Years of Continental Climate Changes that was included as part of the report published by the “2K Network” of the International Geosphere Biosphere Program (IGBP) Past Global Changes (PAGES) project.

Thirty-year mean temperatures for the seven PAGES 2k continental-scale regions arranged vertically from north to south. Colors indicate the relative temperature. The most prominent feature of nearly all of the regional temperature reconstructions is the long-term cooling, which ended late in the19th century. North America includes a shorter tree-ring-based and a longer pollen-based reconstruction. Modified from: PAGES 2k Consortium, 2013, Continental-scale temperature variability during the past two millennia, Nature Geoscience, DOI:10.1038/NGEO1797.

Each color band represents a 30-year mean temperature found on each continent.  Their choice of data visualization method is very compelling, and visualizes a huge amount of data in a small space.

I also love that a good data visualization can attract attention and build awareness all by itself.

Found on the post by Andrew Revkin on the NY Times Dot Earth blog.