About
Randy Krum
President of InfoNewt.
Data Visualization and Infographic Design

Infographic Design

Infographics Design | Presentations
Consulting | Data Visualizations

DFW DataViz Meetup

Join the DFW Data Visualization and Infographics Meetup Group if you're in the Dallas/Fort Worth area!

Search the Cool Infographics site

Custom Search

Subscriptions:


Feedburner

The Cool Infographics® Gallery:

How to add the
Cool Infographics button to your:

Cool Infographics iOS icon

- iPhone
- iPad
- iPod Touch


Read on Flipboard for iPad and iPhone

Featured in the Tech & Science category

Flipboard icon

Twitter Feed
From the Bookstore

Caffeine Poster

The Caffeine Poster infographic

Tuesday
Jan082013

The Ultimate Complete Final Social Media Sizing Cheat Sheet

The Ultimate Complete Final Social Media Sizing Cheat Sheet infographic


The Ultimate Complete Final Social Media Sizing Cheat Sheet by LunaMetrics is a huge (and very long) informational infographic that shows the readers all of the important image sizing requirements for the major social networks.

In June of this year, we published an infographic listing all of the sizing information for images on Facebook, Twitter, Google+, and Pinterest. It was a wildly successful piece of content, totally blowing our expectations out of the water. Unfortunately, while its popularity has flourished, nearly every social network instituted changes to their image sizes, rendering most of the information on the infographic out of date.

We knew we needed to update the information on the cheat sheet, but we weren’t comfortable with simply adjusting one or two figures on the blog post and leaving it as-is. We’d also received a lot of feedback, both on the design and information it contained. We decided to redesign the entire sheet and incorporate a few more social networks.

We also decided to permanently redirect the old sheet here, so that shared tweets, pins, likes, and so on, would lead to the correct sizing dimensions. Additionally, as sizing changes are implemented across social networks, we’ll actively update this sheet – meaning that if you use the embed code at the bottom to share this sheet on your own site, the image will automatically update with changes as they are rolled out. No more out-of-date information.

I love that all of the sizes are shown in correctly proportional rectangles!  Based on their claim, this infographic should also update correctly as they revise it to match the ongiong changes from all of the social networks.  

Some color of the official logos of the different social media networks at each section break would have been helpful to the reader.  The light typeface used at each section break is hard to distinguish from the rest of the design.

Found on Social Media and Social Good

Monday
Jan072013

Can You Protect Yourself from Hackers at CES?

Can You Protect Yourself from Hackers at CES? infographic

Are you headed to CES in Las Vegas this week?  Do you know how to protect your electronic devices?  The Is Your Device Safe at CES? infographic from Novell shows us some heartbreaking stats.

The Numbers Don’t Lie

You don’t think it will ever happen to you, do you? Well, think again. With a laptop or tablet being stolen every 53 seconds you can literally lose your mobile device at any minute. Oh, and by the way, you’re losing a lot more than that precious device: sensitive company documents, passwords, credit card information, etc. So what are you doing to protect that phone/iPad/laptop? Apparently very little as only 4% of smartphones have Mobile Device Management security installed on them. Take a look at a few of the scary numbers and some ideas you could implement to protect your device and your precious content.

This design is long, but there’s a lot of information to share.  I like the simple color scheme, and there’s some really good data included in here.  However, most of the statistics are shown in text only, which is disappointing.

I’ve said it many times here on Cool Infographics.  Big fonts are not data visualizations.  You want your readers to comprehend and remember the numbers you are showing them in your infographic design.  To be successful at that you need to put the numbers into context for the reader, by visually comparing them to another value or showing them the scale of the value.

Thanks to Mat for sending in the link!


Monday
Jan072013

Tomorrow's World

Tomorrow's World infographic

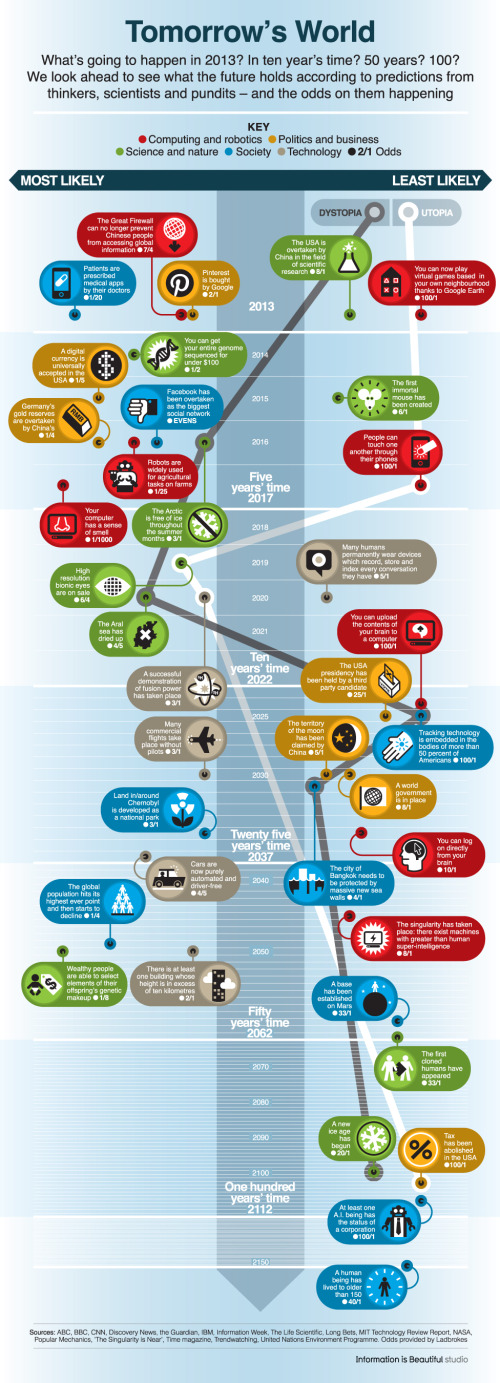
Tomorrow’s World infographic from the BBC maps out many of the future predictions from experts onto a timeline of the next 100 years, and lays out odds on how likely each prediction may come true.

As we begin a new year, BBC Future has compiled 40 intriguing predictions made by scientists, politicians, journalists, bloggers and other assorted pundits in recent years about the shape of the world from 2013 to 2150.

They range from the serious to the fanciful, from the exciting to the petrifying.

And to get a gauge on how likely they are to happen, we asked the special bets department at British betting firm Ladbrokes to give us their odds on each prediction coming true.

The predictions are color-coded by category, placed along the timeline and finally shown in the horizontal direction based on the odds.  This is a really good design, and I like the custom icons for each prediction.

Found on CNET thanks to a Tweet from Dave (@Drodgerson)!

Friday
Jan042013

Cancer in the U.S.A.

Cancer in the USA infographic


The Cancer in the US infographic addresses the current state of the country with its fight against cancer. MesotheliomaHelp.net created this infographic to inspire people to donate to help find the cure of cancer. Find an organization you would like to donate to here.
MesotheliomaHelp.net is dedicated to fighting cancer and providing helpful resources to mesothelioma patients and their caregivers. The purpose of this infographic is to share importance of us focusing on a cure for cancer and asking people to support the organizations that are working hard to find one. Please go to http://www.mesotheliomahelp.net/beat-cancer to donate to your favorite cancer charity today! 

I really like this design style and color scheme.  It keeps a serious tone overall to go with the serious topic, the visuals are simple and clear, and the story path is easy to read from top-to-bottom.  The light gray paper backgound texture also provides clear boundaries to the infographic when displayed on a white background (like this blog).  The lined up person icons to represent “1,500 people die each day” would be easier to understand with ten icons in each row.  

I like idea behind the icons and the stacked grids of squares in “Cases of Cancer by Type”, but I’m unclear as to the values being visualized.  It appears to be the percentage of deaths of of the total cases of each type of cancer, but that percentage value isn’t shown anywhere.  The rows of squares should also be ten squares across to make the visualization easier to understand.

The “Mortality from Cancer” visualization is a basic line chart, but that visual does such a great job of telling the story of the overall trend over time.  I think this particular section should have been bigger, since that data is so impressive.

The footer should include a copyright statement, and the URL to the original, full-size infographic on the MesotheliomaHelp.net site.

Thanks to Oakes for sending in the link! 

Wednesday
Jan022013

Comparing NFL Stadium Screens

Comparing NFL Stadium Screens infographic

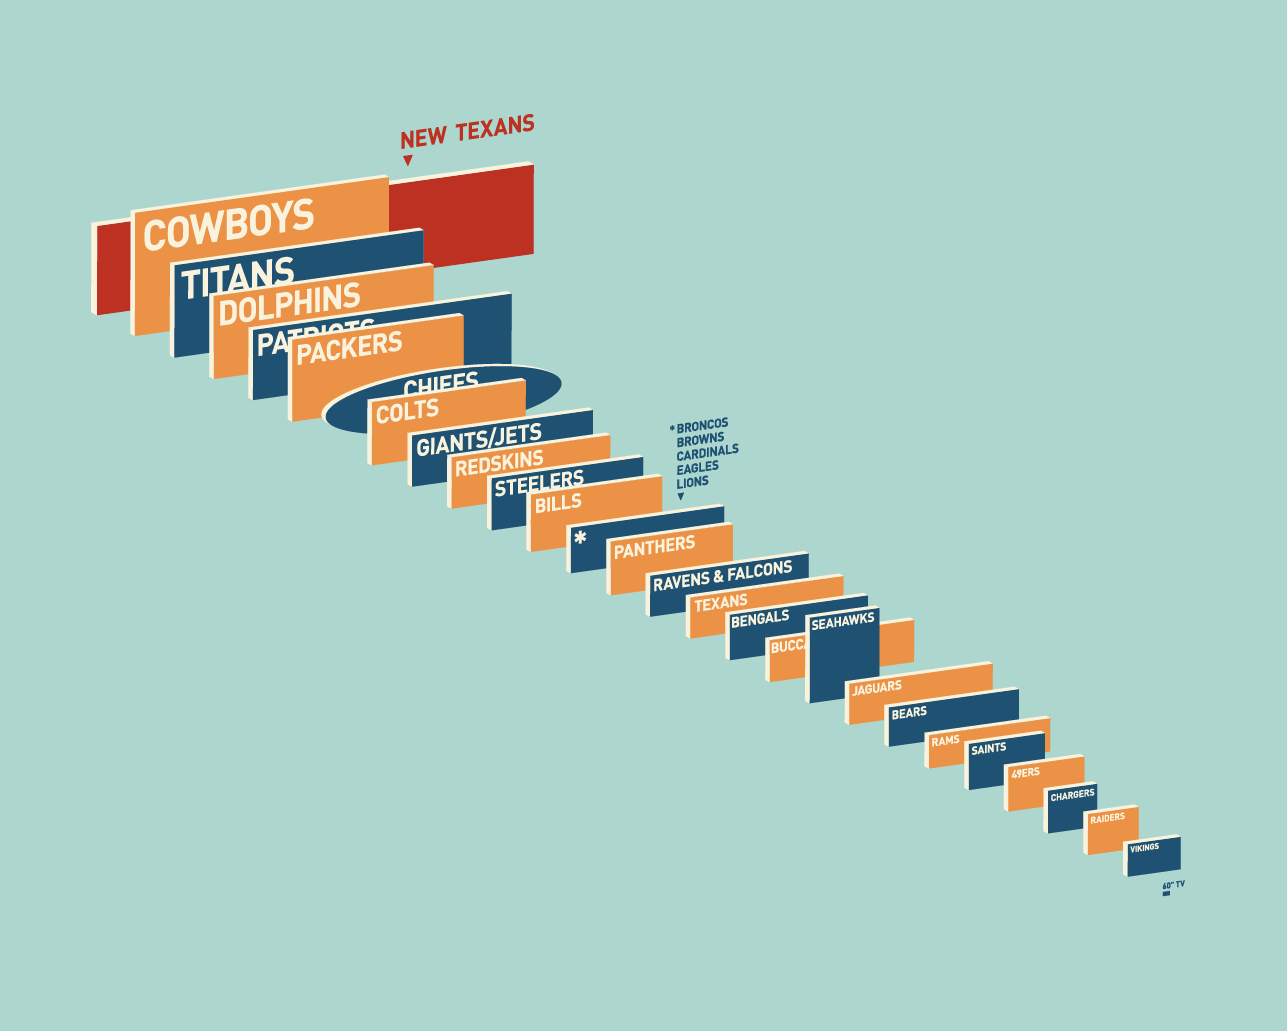
This visual comparison of NFL Video Screens was uploaded by reddit user dbeat after the announcement of the new video display being built for the Houston Texans’ Reliant Stadium.

I would have liked to see a link to the data behind all of the screen sizes, but this visual representation does a great job of telling one story really well.  The readers can easily find their favorite team, and understand how they stack up.

Found on FlowingData and Deadspin

Monday
Dec312012

Water Changes Everything

I have heard it argued that clean water has been the single greatest medical advancement in mankind’s history.  With effects including longer lifespan, reducing diseases, reducing birth defects and generally improving health, it’s easy to undertand how important clean water is.  Water Changes Everything is an infographic promotional for the Charity Water organization.

I’ve started the “Start 2013 Clean” campaign to raise $1,000 for Charity Water from Cool Infographics readers.  Start off 2013 right, and help me support making the world a better place.

Almost a billion people live without clean drinking water. We call this the water crisis. It’s a crisis because it only starts with water — but water affects everything in life.

Health. Education. Food security. And the lives of women and children, especially.

We can end the water crisis in our lifetime. But first we have to let everyone know it’s happening. Learn how water changes everything — and share this with everyone you know. 

It was an infographic map design by John Snow in 1854 that led to the discovery that a cholera outbreak in Soho, London was geographically tied to the location of a water well.  At the time, the popular belief was that cholera was airborne, and people would become sick by breathing “bad air.”  But John Snow’s early data visualization of reported cases was used to convince local officals to shut down the potentially contaminated well (by removing the handle).  This action is commonly credited with ending the epidemic.

Original map made by John Snow in 1854. Cholera cases are highlighted in black.

Video was designed by Jonathan Jarvis, who also designed the Crisis of Credit infographic video, and the voiceover is Kristen Bell.

Found on Daily Infographic and FastCoDesign

Thursday
Dec272012

Blood Pressure: Know Your Numbers


Blood Pressure: Know Your Numbers infographic

Being knowledgeable about your health is always helpful. Your blood pressure is no exception, 1/3 people who have strokes die because of high blood pressure. The Blood Pressure infographic created by westfieldhealth.com describes what blood pressure is, what it means, and then how to maintain a healthy blood pressure. The infographic was found on behance.net.

High blood pressure puts strain on your heart and increases your likelihood of developing health problems in the future. It is one of the most common causes of heart attacks and strokes, and is also a risk factor for heart disease, kidney disease and dementia. One in three people in the UK have high blood pressure even though just a few simple steps can help combat it. By checking your blood pressure, exercising regularly and reducing the amount of salt in your diet you can significantly lower your blood pressure and enjoy a healthier lifestyle.

The infographic provides some useful tips and advice about how you can keep your blood pressure in check.

This is a really good design with great information for people.  I wish it was a little bit easier to understand though.  A few of the data visualizations are not clearly explained.

In Blood pressure High Spots, I don’t understand what the size of each symbol on the UK map represents.  The implication is the amount of reports high blood pressure cases, but the values are not shown.  I don’t understand the right circle at all.  The percentage numbers seem to be spread on a map, but it’s not the UK, and I don’t recognize it.

In Looking After your Blood Pressure, I think this diagram is completely artistic, even though it seems to imply that it’s a data visualization.

In A Guide to Blood Pressure Levels, the area chart seems to be a visualization over time of some sort, but no x-axis values are shown, so the readers can’t tell what this chart means.

Thanks to Luke for sending in the link!

Wednesday
Dec262012

Top 20 Field Service Management Software Solutions

Top 20 Field Service Management Software infographic

The new Top 20 Field Service Management Software infographic from Capterra continues their series of “Top 20 Most Popular” infographics for different software categories.  I’ve previously posted about the Top 20 Marketing Automation Software Solutions and the Top 20 Medical Records Software Solutions.

This design shows a little more detail behind how they score and rank the different software options.

Field Service Management software serves companies that send technicians or other employees into the field by helping them automate scheduling and dispatching. Below is a look at the most popular options as measured by a combination of their total number of clients, active users and online presence. In order to see a comprehensive list, please visit our Field Service Management Software Directory.

Capterra developed a popularity index consisting of three components to rank the field service management providers: number of customers (40%), number of end users (40%), and online presence (20%). The online presence metrics included traffic estimates from Compete.com, as well as the company’s number of LinkedIn followers, Facebook page likes, Twitter followers, and Klout scores – each weighted equally to comprise 20% of the vendor’s overall score.

The stacked bars to showing the three separate score metrics works nicely, and is a clear visual of the descending total scores.  The Rank numbers are in colored boxes that match the primary brand colors of each software company, but the readers don’t know that.  Without seeing the actual company logos, the colors just look random and create some unnecessary visual noise.

By not showing the company logos throughout the design, it’s harder for the reader to see where a particular company appears in the different sections.  A visual logo would be easy to recognize at a glance, but in just text, the reader has to read every entry to try to find a match.

Nice, clear Call-To-Action at the end of the design, so the target audience readers know what they should with this information.  The footer should also include a copyright statement and the URL link to the infographic landing page on Capterra’s site so readers can find the original, full-size version.


Wednesday
Dec262012

Star Trek: The Original Series

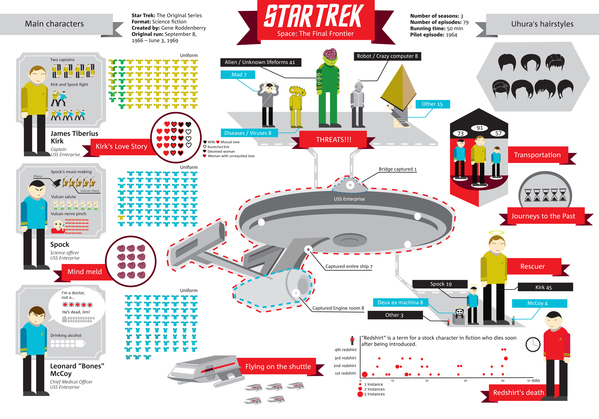
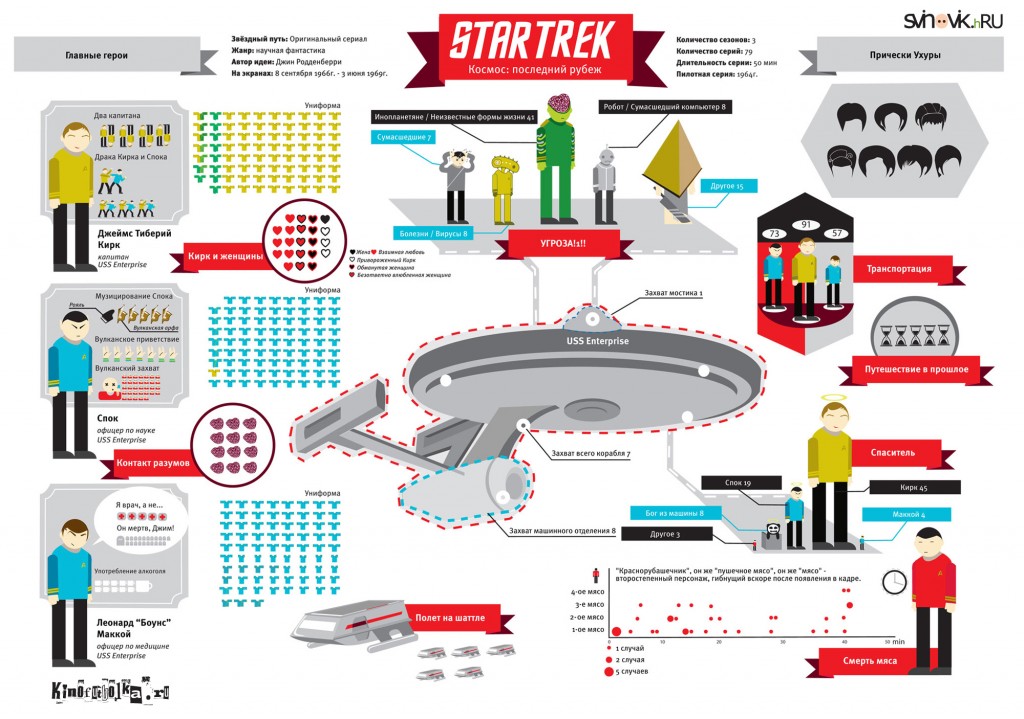
The Star Trek infographic designed by Natalya Platonova was originally designed in Russian for Svinovik.ru. This infographic is a visual overview of some quirky statistics from the complete original series (three seasons).

Overall, very well done!  As a Trekkie myself, the visualizations are fun facts about the series, and well designed.  I like that the quantitative values (like the uniforms worn) are shown as the actual numbers and not scaled. 

A couple of framing pieces of information would have been helpful.  The original design is published along with a text article, but some introductory text in the infographic itself would be nice because the image file gets shared without any of the text from the article.  The fotter should include some type of copyright or Creative Commons license and the URL for readers to be able to find the original, full-size versions.

Here’s the original version in Russian:

Found on Visual Loop!

Monday
Dec242012

Defending the Death Star

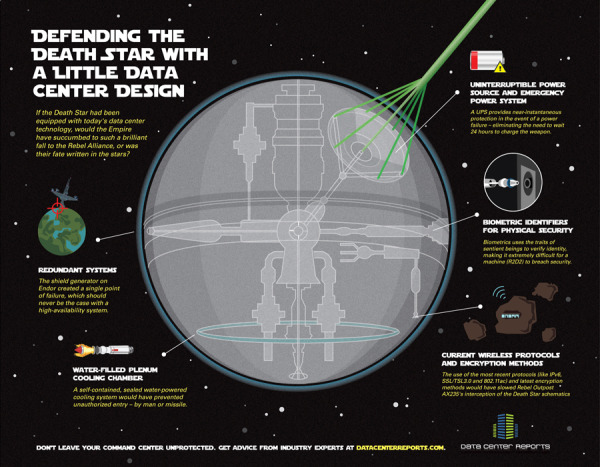
Defending the Death Star with A little Data Center Design infographic

Old age meets new age. Defending the Death Star with A little Data Center Design takes a concept that people can relate to (Star Wars) and applies modern day data center technologies. Brought to you by Data Center Reports.

When Aristotle first explained the concept of “hamartia” in Poetics, he probably didn’t know just how many hero and villain stories would be driven forward by fatal flaws in character, judgment or planning. The Star Wars saga is an epic tale that is powered by fatal flaws – yet we couldn’t help but wonder how things might have turned out had the Empire used a little of today’s security insights to better protect the superweapon better known as the Death Star.

This infographic design tells a good story with illustrations.  No big data sets to visualize, but a simple story that’s incredibly easy for the reader to understand.  The Star Wars comparison puts the different technologies into context for the reader.

The footer should include a copyright and the URL link to the original infographic so readers can easily find the original high-resolution version.

Found on Data Center Reports